From the Aquarium Lab
Oxidation Reduction Potential of Substrate
Evaluating ORP Values of Substrate Size, Depth, and the Effect of Current

By Tony Griffitts
Published - 20240113, Revised:
This article is a follow-up study to the article “From the Aquarium Lab - Substrate Denitrification - Substrate Size Experiment,” published on 2023.09.21. After it was published, Dr. Tom Barr, an internationally recognized planted aquarium expert that I’ve known for a couple of decades and a customer of the Aquaworld Aquarium retail store (2001-2006), suggested I check the Oxidation-reduction potential (ORP) or redox potential values of the substrate.
This experiment looked at the ORP values of the substrates used in the “From the Aquarium Lab - Substrate Denitrification - Substrate Size Experiment” article and evaluated if the current affected the ORP values of 60 mesh (grit) sand.
Since I already had an ORP controller/meter that was being used on a display system to monitor shifts in ORP values over a 24-hour period, I already had the test equipment. I bought two more probes for redundancy and record variability between the probes.
The “From the Aquarium Lab - Substrate Denitrification - Substrate Size Experiment” article concluded that 60 mesh sand aided in the denitrification of the system, while 10 mesh and 3 to 1 mesh (pea gravel) increased nitrate (NO3-). Mesh or grit size indicates how many of the largest grains (end to end) it takes to equal 1 cm. Collecting ORP values of the substrate can show if anoxic environments could be detected in the three different grain (grit or mesh) size systems.

ORP is measured in millivolts (mV). Oxidizers have a positive ORP value, while reducers have a negative ORP value. ORP measures a system's ability to oxidize or reduce a substance in the water. An oxidizing agent, such as oxygen, increases the ORP value. In contrast, reducing agents such as carbonaceous biochemical oxygen demand (cBOD) decrease the ORP value.
Water column values for healthy freshwater systems range between +300 and +500 mv[1]. The authors display aquariums (PAKIS method) range between +330 to +461 mV. When dissolved oxygen levels are high, the ORP value is high[2].
Temperature can affect the rate of chemical reactions in the water, affecting the ORP value. Warmer water generally tends to have a lower ORP than colder water (higher oxygen-carrying capacity).
The pH of the water can also influence the ORP values. In acidic conditions, the ORP values tend to be lower, while in basic conditions, the ORP values are higher.
Organic matter can act as a reducing agent and lower the ORP value of the water. Substances in the water, such as iron or hydrogen sulfide, are reducing agents and lower the ORP values.
It takes time for ORP probes to stabilize, and the values have a detectable drift over 24 hours. Initially, three probes were allowed to stabilize for 10 days in the water column and collect data on the variation in mV values between probes. After 10 days, the probes displayed values ranging from +342 mV to +376 mV, with the three probe average being +353.3 mV.
The substrate is responsible for diverse biological processes essential to maintaining healthy aquatic systems. Ensuring the substrate is deep enough to support anaerobic bacteria is vital to aquarium and plant health. The following is a list of biological processes that take place in the substrate and detritus on the bottom of the aquarium:
| Process | Bacteria Type | Importance |
|---|---|---|
| Ammonia oxidation | Aerobic | Detoxifies ammonia. |
| Nitrite oxidation | Aerobic | Detoxifies nitrite. |
| Denitrification | Anaerobic | Creates H2 gas, detoxifies nitrate. |
| Incomplete denitrification | Anaerobic | Creates nitrite. |
| Hydrogen sulfide production | Anaerobic | Creates H2S gas. |
| Hydrogen sufide oxidation to sulfate | Aerobic | Creates a micronutrient (sulfate). |
| Fermentation | Anaerobic | Creates acetic acid, which can be used for denitrification. |
| Methane production | Anaerobic | Creates a gas that can be converted to CO2. |
| Methane oxidation | Aerobic | Creates a macronutrient (CO2). |
| Decomposition of detritus | Aerobic | Creates macro and micronutrients. |
| Decomposition of detritus | Anaerobic | Creates macro and micronutrients. |
| Manganese reduction | Anaerobic | Creates a bioavailable micronutrient (Mn). |
| Iron reduction | Anaerobic | Creates a bioavailable micronutrient (Fe). |
The ORP mV values to look for in the substrate to show environments where aerobic and anaerobic processes take place are listed below[3]:
| Biochemical Activity | Approximate ORP range* |
|---|---|
| Nitrification | +150 to +500[1]* |
| Carbonaceous Biochemical Oxygen Demand (CBOD) | +50 to +250 |
| Biological phosphorus removal | +25 to +250 |
| Denitrification | -50 to +50 |
| Biological phosphorus release | -100 to -250 |
| Fermentation (acid formation) | -40 to -225 |
| Sulfide formation | -50 to -250 |
| Methane formation | -175 to -400 |
*Nitrification may continue at even higher levels.
Three 12-gallon cubes (14" x 14" x 14" [53 L, 35.5 x 35.5 x 35.5 cm]) aquariums were set up (2022.11.06) and coupled to provide the same water chemistry and similar microbe biodiversity. Each aquarium was set up with 2 inches (5 cm) of substrate. The first system has 60 mesh (grit) sand, the second 10 mesh sand, and the third set up with pea gravel (3 to 1 mesh).

Each aquarium held about 8.25 gallons (31.23 L) of water above the substrate.
Filtration and current in each aquarium were supplied by Hygger (sponsor of this research) with the Aquarium Internal Power Filter HG-009-S (SKU: HGB009). Initially, the spray bar was aimed straight at the surface to maintain a moderate system current.
For this experiment, ORP data was collected using a Milwaukee MC510 PRO Digital ORP Controller and three probes.


The following is a list of the equipment and test kits used to collect data:
- Hanna Marine Nitrate High Range Checker HC H1782 (works for freshwater)
- Hanna Low Range Phosphate Checker H1713
- Hanna Freshwater Alkalinity Colorimeter HI775
- Hanna TDS Tester HI98301
- Milwaukee MC120 Pro Digital pH Monitor
- API GH Test Kit
- AMES 12:1 Infrared Laser Thermometer Item 63985
| Test | Value |
|---|---|
| Nitrate Hanna | 16.5 ppm |
| Phosphate Hanna | 1.5 ppm |
| KH Hanna | 61 ppm |
| TDS Hanna | 225 ppm |
| pH at 7:00 AM. | 7.8 |
| GH API | 8 dGH |
| Temperature AMES | 79° F (26.1° C) |
| Water Column ORP Value - Probe #1 | +342mV |
| Water Column ORP Value - Probe #2 | +367mV |
| Water Column ORP Value - Probe #3 | +351mV |
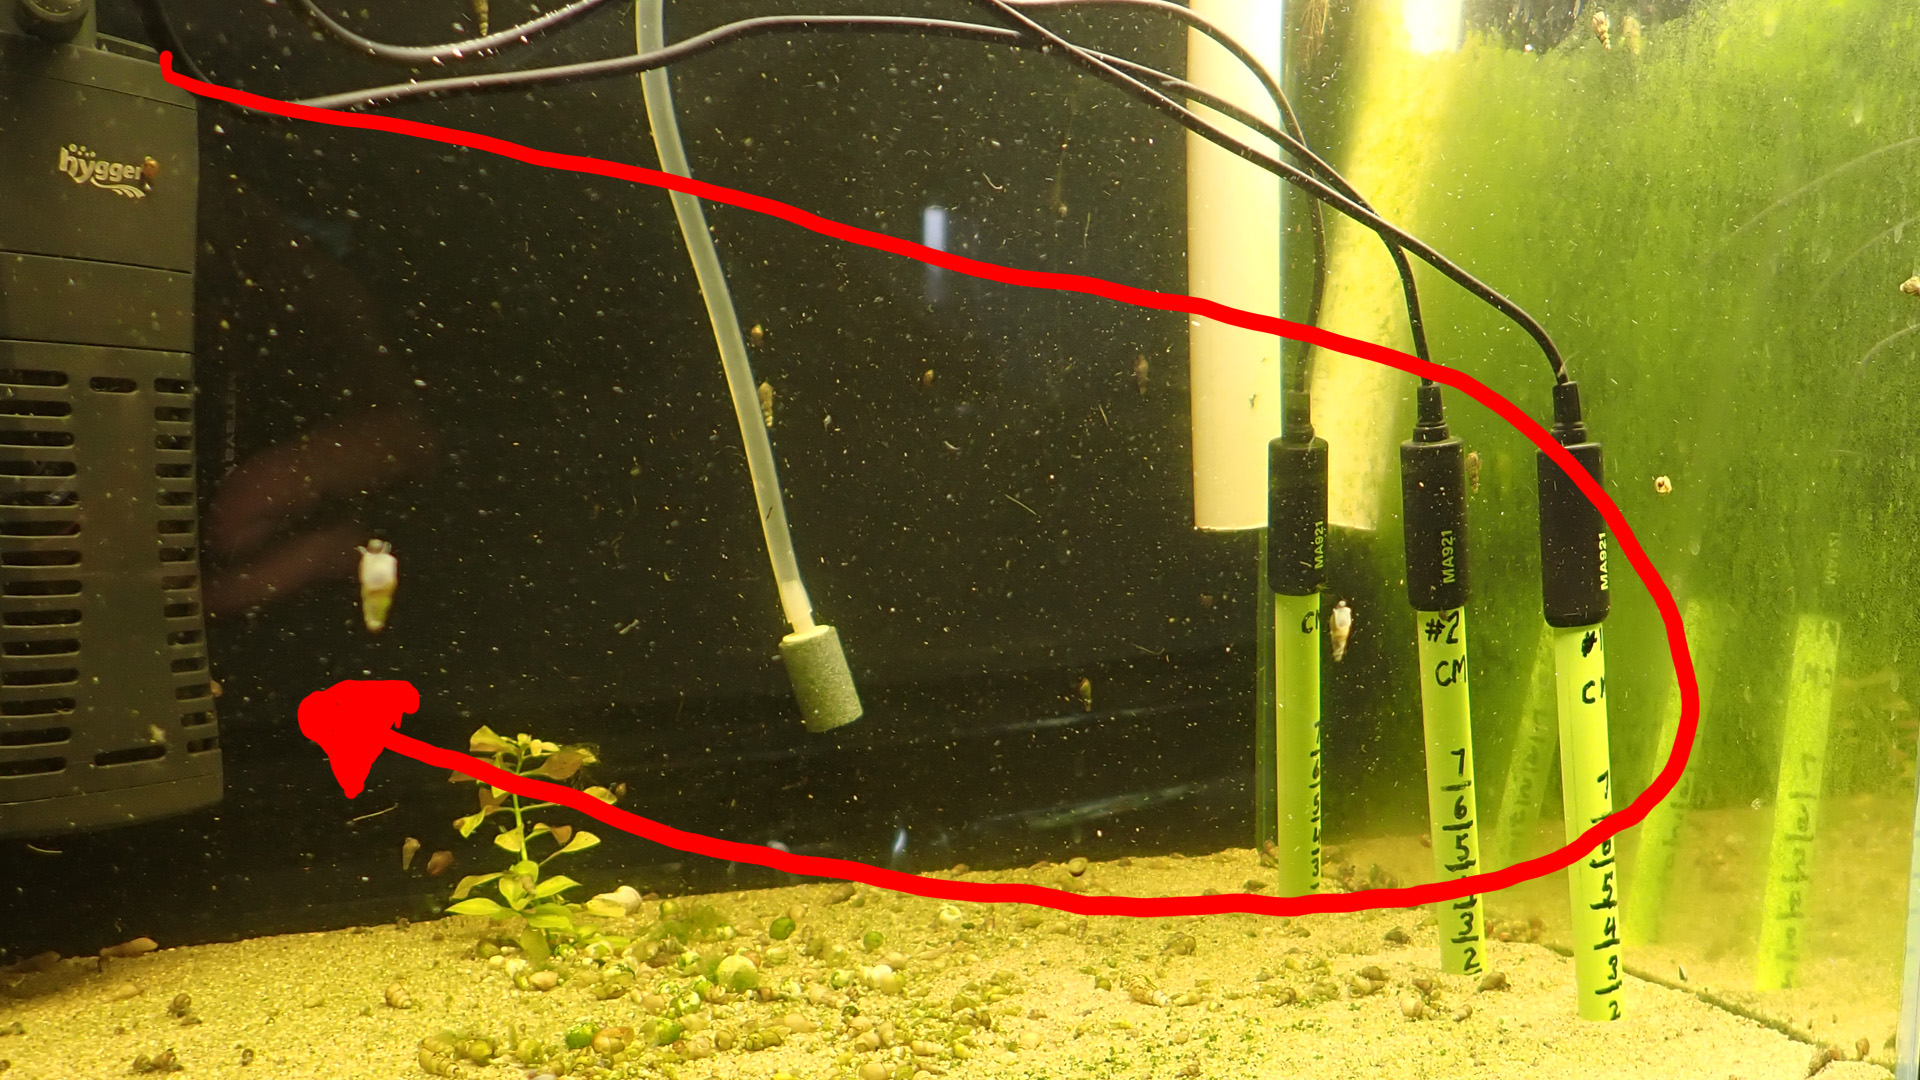
The probes were placed at the bottom of the substrate in each tank to record the value and see if an anoxic environment could be detected. Each tank has 2 inches (5 cm) of substrate that has been in the system for one year.
The 5 cm results collected after probes were in the substrate for one week:
| Tank # | Substrate Type | Anoxic Environment Detected | mV Value |
|---|---|---|---|
| 1 | 60 mesh | Yes | -430 |
| 2 | 10 mesh | No | +354 |
| 3 | 3 to 1 mesh | No | +366 |
The ORP test results validate the findings in “From the Aquarium Lab - Substrate Denitrification - Substrate Size Experiment” article. An anoxic environment was detected 5 cm down in the substrate in Tank #1, which showed significant nitrate reduction in the previous experiment. The results of tanks #2 and #3 have shown a substantial presence of oxidizing agents, which explains why nitrate accumulated in these systems in the previous experiment.
Probes were all moved to the 60 mesh sand to explore the depth of where the anoxic environment begins. Data was collected at 1 to 4 cm of depth:
| Substrate Depth | 3 Probes mV Value | Average |
|---|---|---|
| 1 cm | #1 =-455 #2 = -405 #3 = -434 |
-431 |
| 2 cm | #1 = -445 #2 = -457 #3 = -455 |
-452 |
| 3 cm | #1 = -428 #2 = -444 #3 = -432 |
-434 |
| 4 cm | #1 = -444 #2 = -458 #3 = -444 |
-448 |
Current across the top of 60 mesh sand was evaluated for influence on ORP values in the substrate. The outflow from the spray bar from the Aquarium Internal Power Filter HG-009-S (SKU: HGB009) was positioned so the flow would hit the right side glass of the aquarium, drive down to the substrate, and then flow from right to left. The current created a significant flow across the substrate but was insufficient to move the sand.
To allow time for stabilization, ORP mV values were collected two days after the three probes were moved to a depth of 2 cm within the substrate.
| Substrate Depth | 3 Probes mV Value | Average |
|---|---|---|
| 2 cm | #1 = +250 #2 = +64 #3 = +337 |
+217 |
| 3 cm | #1 = +276 #2 = -293 #3 = +383 |
+122 |
| 4 cm | #1 = -462 #2 = -455 #3 = -451 |
-456 |
Additional data was collected when the filter was removed from the system when probes were in 1 cm of substrate. Probe #1 started at +301 mV, and in 1.5 hours, the value was -98 mV, and after 14 hours, it was -422 mV.
This experiment shows that the current in the aquarium affects how deep the substrate needs to be to create an anoxic environment. With a moderately strong current across the substrate, an aerobic environment existed at 3 cm but turned strongly anoxic at 4 cm.
The ORP values collected from the three substrates indicate that 60 mesh sand can provide a beneficial anoxic environment at a depth of less than 1 cm. 10 mesh and pea gravel are strongly aerobic and provide an environment for oxidizing agents even at 5 cm in depth. The experiment also shows beneficial anoxic environments in 5 cm (2 inches of gravel) do not exist in ordinary aquarium conditions.
The shift from aerobic to anoxic environments in fine sand occurs in less than 1 cm.
Current can affect where the anoxic environment begins in the substrate. A robust current across the surface of the sand will lower where the anoxic environment starts in the substrate.
These experiments created a new question:
- Does a robust current increase substrate denitrification?
1. Government of Northwest Territories, Canada, Oxidation-Reduction Potential (ORP)
https://www.gov.nt.ca/ecc/sites/ecc/files/oxidation-reduction_potential.pdf
2. What is Oxidation-Reduction Potential (ORP) for Lakes?
https://www.moleaer.com/blog/what-is-oxidation-reduction-potential
3. ORP Management in Wastewater as an Indicator of Process Efficiency
https://www.ysi.com/ysi-blog/water-blogged-blog/2013/08/orp-management-in-wastewater-as-an-indicator-of-process-efficiency