Freshwater Carbon Dosing: How to Supercharge Anaerobic Nitrate Reduction
From the Aquarium Lab
By Tony Griffitts


Published - 20261010, Revised:
Nitrate (NO3) accumulation in aquariums has been a common issue for hobbyists since the hobby's beginning. Many hobbyists use aquatic plants and regular water changes to address excessive nitrate levels. In closed systems like aquariums and ponds, aquatic plants and anaerobic bacteria and archaea that live in the anoxic (lacking oxygen) environment of the substrate can naturally reduce NO3.
Natural Nitrate Reduction (NNR) is the last step in the Nitrogen Cycle before it starts over again.
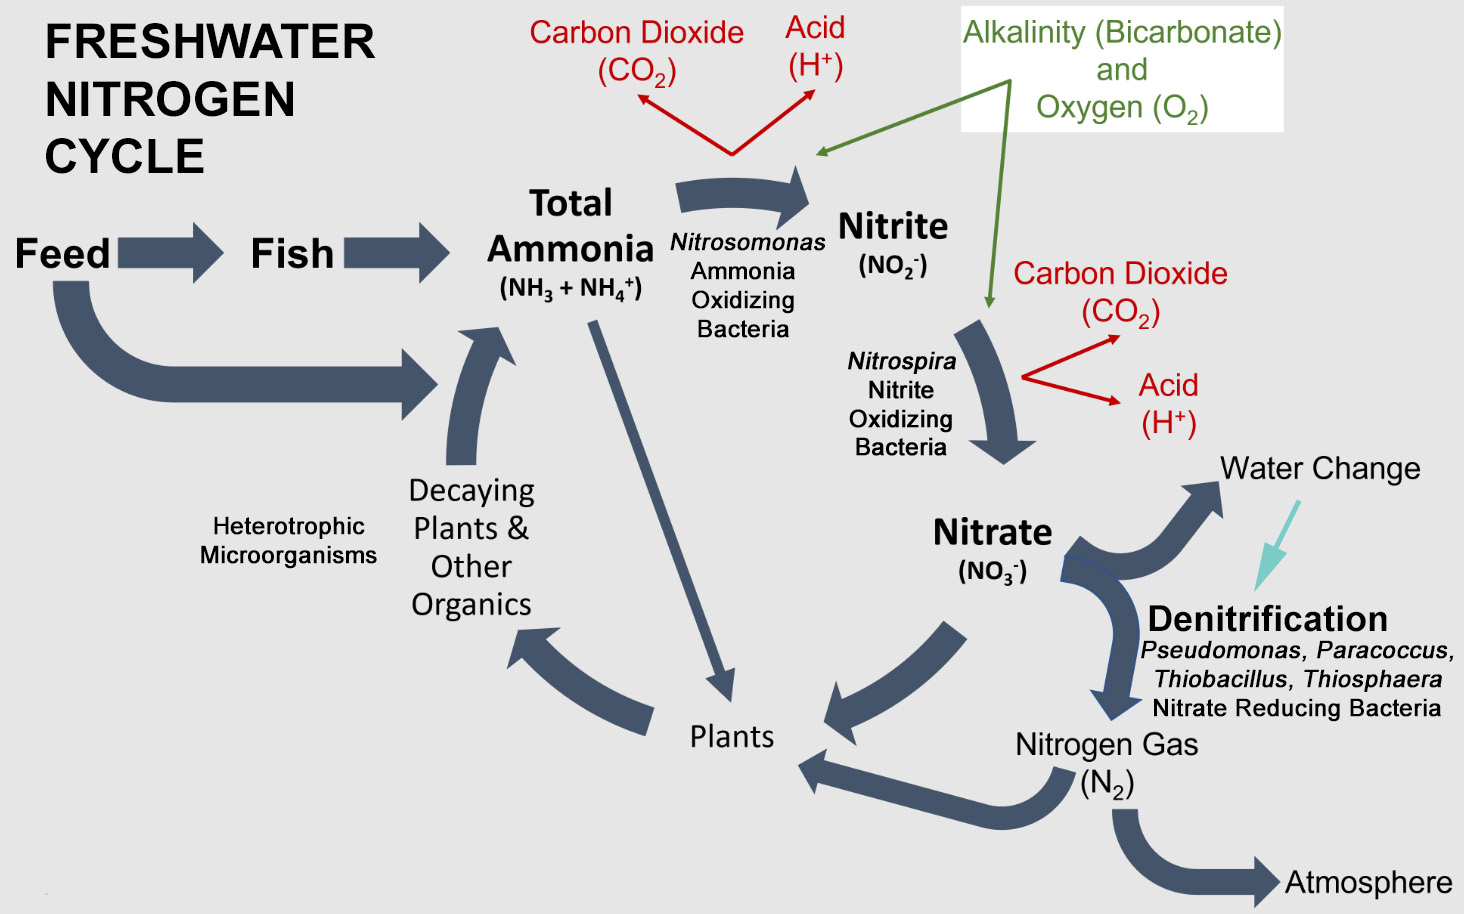
All closed freshwater aquatic systems are unique, ranging from no NO3 accumulation in balanced systems to over 100 ppm within a month in unbalanced systems. The animal bioload and feeding frequency directly affect whether a system accumulates NO3.
Systems that start out balanced can eventually become unbalanced due to animal reproduction without population control.
For this Aquarium Lab research, anaerobic bacteria and archaea that primarily live in the anoxic environment of sand are the targets of organic carbon dosing.
This research examined whether organic carbon dosing is an effective strategy for closed freshwater systems with excessive NO3 production. Carbon dosing is not recommended for balanced systems or systems that accumulate minimal NO3 in a month. This research article discusses dosing issues in low-NO3 systems later.
When conducting experiments in freshwater aquatic systems, the water chemistry parameters are noted as they can influence the toxicity of additives. Examples:
- Soft water will, in some cases, increase heavy-metal toxicity.
- Low KH systems will convert ammonia (toxic) to ammonium (not toxic).
The results apply only to the water chemistry parameters used in this research and should not be applied to all freshwater aquatic systems.
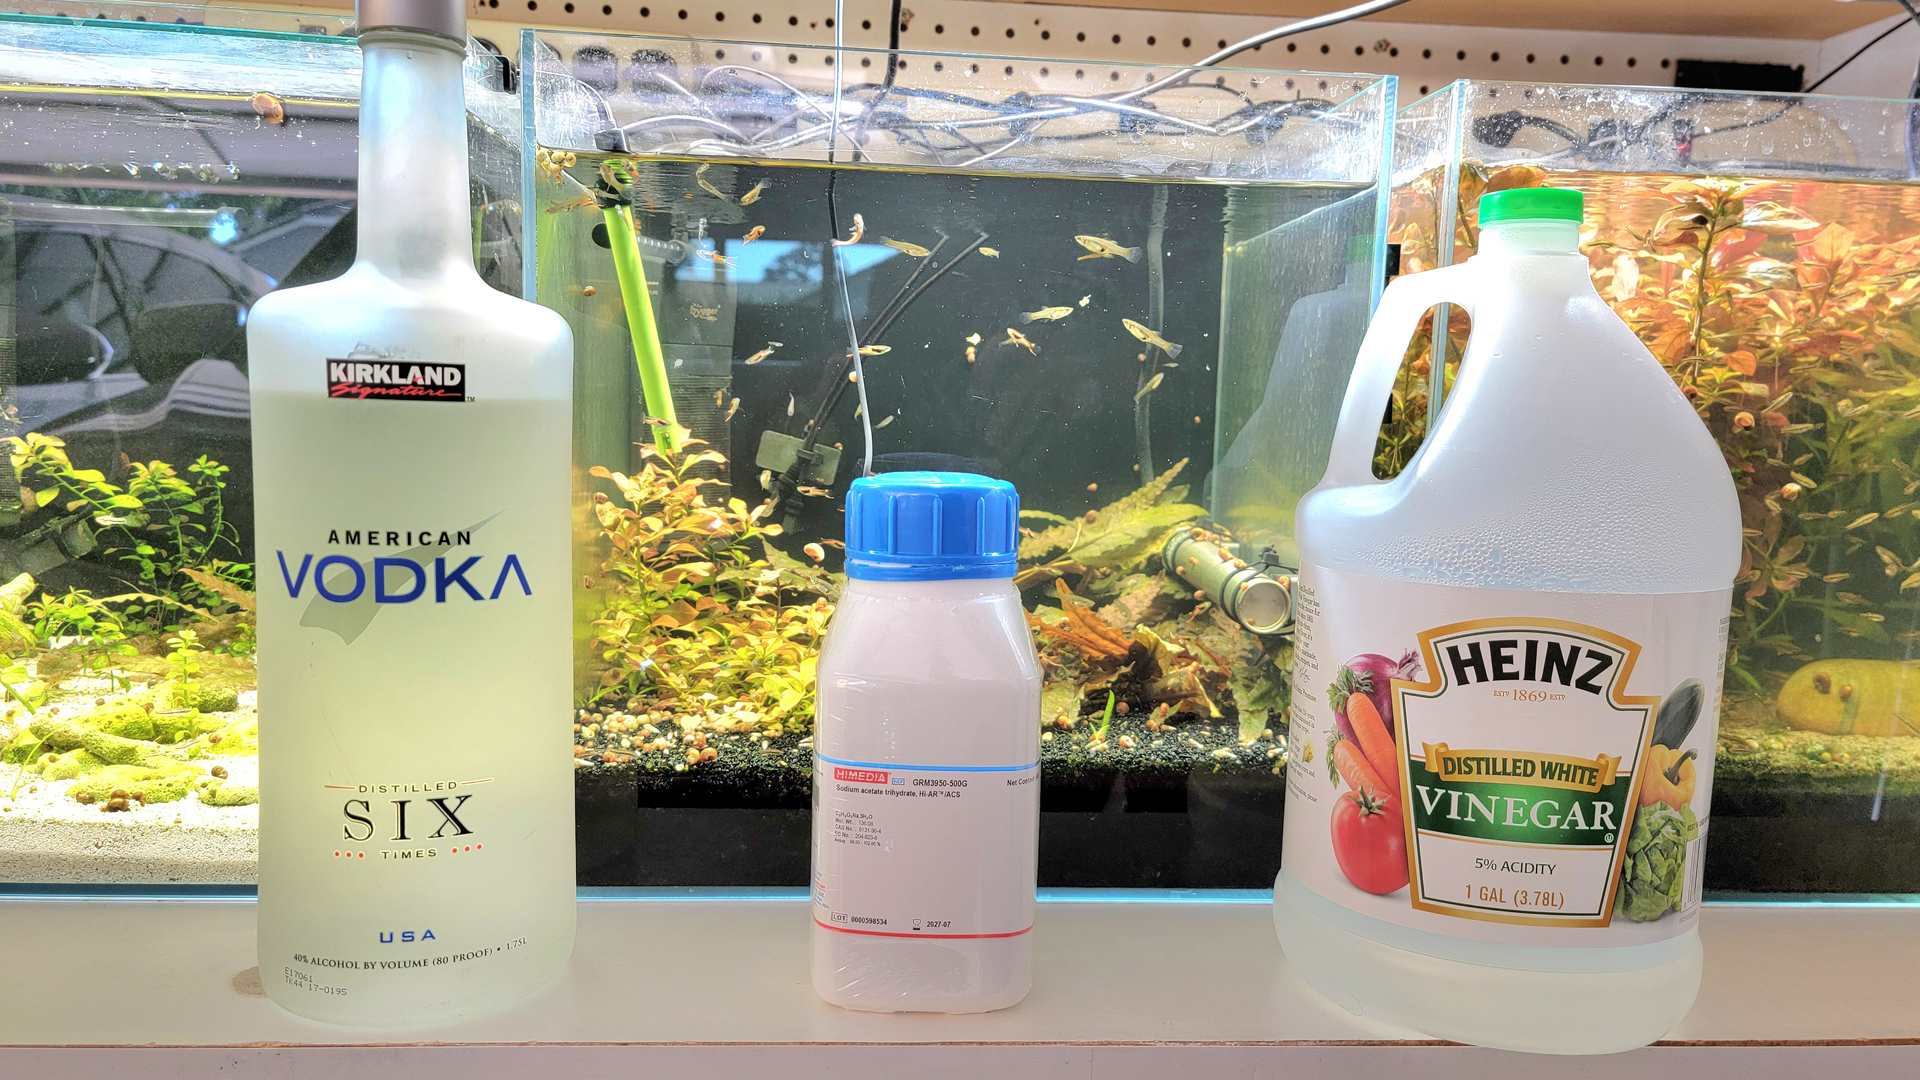
For this freshwater lab research project, three sources of commercially available carbon:
Sodium Acetate Trihydrate: Dry crystals mixed with distilled water.
40% Ethanol (Vodka): A common alcoholic beverage.
5% White Vinegar: A common ingredient for food.
The lab experiments were evaluated for the following:
- Effectiveness in reducing NO3.
- Effect on water chemistry:
- Total Dissolved Solids (TDS)
- General Hardness (GH)
- Carbonate Hardness (KH)
- pH
- Phosphate (PO4)
- Changes in aquatic plant health.
- Changes in Snail health.
- Changes in Fish health.
Nitrate is not harmless. Unfortunately, many hobbyists believe that because a certain amount of NO3 does not kill fish within 24 hours, it is safe. Often, in aquatic ecosystems, researchers focus on how much of a chemical will kill organisms, rather than what long-term chronic exposure does to health. Many hobbyists misinterpret the data to mean NO3 is harmless.
Daniel F Gomez Isaza, Rebecca L Cramp, and Craig E Franklin's paper published in Conservation Physiology, Volume 8, Issue 1, 2020, titled Simultaneous exposure to nitrate and low pH reduces the blood oxygen-carrying capacity and functional performance of a freshwater fish[1], shows that methemoglobin is detectable at low levels of NO3 and increases as the nitrate goes up.
Methemoglobinemia (MetHb), also known as brown blood disease, prevents oxygen from reaching an animal's cells. Nitrate is an environmental physiological stressor for fish.
While nitrate is less toxic than ammonia and nitrite, long-term exposure can affect fish growth, reproduction, and the immune system's ability to protect against disease. Some freshwater fish species exposed to very high nitrate levels for an extended period are known to develop hole-in-the-head (HITH), a condition in which the skin around the head recedes. The HITH condition is commonly seen in Oscars (Astronotus ocellatus) and other large Central and South American cichlids.
Discus hatcheries often perform nearly 100% water changes daily to keep NO3 levels as low as possible, as they have found that allowing it to accumulate inhibits fry growth.
The aquarium hobby has many myths; unfortunately, substrate is the target of many, and some lead to dangerous practices that cause many fish deaths every year. Here is a list of common aquarium substrate myths:
- Anaerobic bacteria in the substrate can cause hydrogen sulfide gas pockets that can bubble into the water column and kill fish.
- This cannot happen because hydrogen sulfide is a gas driven out of solution by current and surface agitation. Aerobic bacteria and archaea in the substrate oxidize hydrogen sulfide into sulfate, which aquatic plants can use as a nutrient.
- This myth is often used to justify the environmentally destructive practice of vacuuming substrate.
- Ammonia pockets can develop in the substrate and can be released if the substrate is disturbed.
- This cannot happen, as the ammonia- and nitrite-oxidizing bacteria and archaea heavily colonize the substrate and quickly convert ammonia/ammonium to nitrite, then to nitrate. Some microbes can directly convert ammonia/ammonium to nitrate.
- If the substrate is gravel, uneaten fish food trapped between the grains can still contain undecomposed nutrients. Disturbing gravel in great quantities can temporarily increase food for heterotrophic bacteria and archaea, which can reduce oxygen and spike ammonia and nitrite levels until the chemolithoautotrophic (autotrophic) bacterial colonies recover from the disruption. The ammonia doesn't come from the substrate; it comes from flooding the water column with food for heterotrophic bacteria and archaea to process. That activity can temporarily increase ammonia/ammonium production.
- You need to vacuum the substrate regularly to prevent anaerobic bacteria from growing.
- Vacuuming the substrate in a system without an undergravel filter harms the aquarium's health. It destroys essential oxic and anoxic environments while displacing beneficial microbes (bacteria and archaea) to areas where they cannot thrive.
- Once disrupted, these substrate ecosystems can take weeks or months to recover. Vacuuming a large portion of the substrate at once can lead to elevated ammonia and nitrite levels a few days later, since the large colony of oxidizers is no longer in contact with the oxygen, ammonia, and nitrite in the water column.
- Anoxic zones in the substrate can cause root rot.
- This is common when the organic soil substrate beneath a sand cap (Walstad Method) is overly nutrient-rich (toxic), causing roots to die and leading to overall poor aquatic plant health.
While plants need a wide range of nutrients, there is a limit to how much they can be exposed to before it becomes toxic.
Healthy aquatic plants transport oxygen to their roots (rhizosphere) and rhizobacteria/archaea. A non-toxic, healthy substrate will support strong root growth deep into the anoxic layer, where beneficial anaerobic heterotrophic bacteria and archaea live. - The filter contains most of the bacteria responsible for the nitrogen cycle.
- False. Autotrophic bacteria and archaea that oxidize ammonia and nitrite in the nitrogen cycle colonize relatively clean surfaces. The thick, slimy mats in filters are where the heterotrophic bacteria and archaea live.
Heterotrophs are responsible for the decay of organic matter.
Autotrophic microorganisms that drive the first stages of the nitrogen cycle densely colonize the substrate and other clean surfaces exposed to dissolved oxygen. In most cases, the clean-surface autotrophic bacteria and archaea require are located in and on the substrate, aquatic plants, decor, and water features.
Often overlooked by hobbyists, anaerobic bacteria and archaea that live in the substrate's anoxic environment slowly reduce NO3. For anaerobic denitrification to occur, the system needs the following:
- Water chemistry that supports anaerobic bacteria and archaea.
- An anoxic environment in the substrate.
- Bioavailable organic carbon (heterotrophic bacteria and archaea food).
Freshwater chemistry is highly variable and directly affects which microbes can thrive. Microbial populations shift significantly when the system's pH consistently remains below 6.0. For the research experiments in this study, pH and KH (alkalinity) were monitored to maintain system pH above 7.0.
Sand substrate properties allow anoxic environments to develop[2], in which denitrification by anaerobic bacteria and archaea can reduce NO3 to N2 (nitrogen gas)[3].
Denitrification can occur in all aquarium substrates, provided they are deep enough and do not experience excessive current. Sand substrate allows the anoxic environment to develop in the first centimeter (cm) when an average aquarium current is present[2].
Anaerobic denitrification is slow and requires a source of bioavailable carbon to feed Nitrate-Reducing Bacteria and Archaea (NRBA). Bioavailable organic carbon is naturally produced in the substrate's fermentation layer as acetic acid, within the Oxidation-Reduction Potential (ORP) range of -40 to -225 millivolts (mV). The denitrification layer ORP range is -50 to +50 mV[2].
Acetic acid produced in the substrate limits how much NRBA can reduce NO3. The NRBA population directly affects how fast NO3 can be reduced.
The NRBA population can grow quickly when bioavailable organic carbon is introduced. This increase in food availability for NRBA can supercharge NO3 reduction. Adding organic carbon will reduce nitrate faster than a system that is wall-to-wall with aquatic plants.
Carbon dosing is a very effective way to reduce nitrate in overstocked freshwater aquariums and ponds. While carbon dosing's primary intent is to reduce NO3 without a water change, it will also have additional benefits in a closed-system environment.
Carbon (acetic acid) dosing will increase the population of heterotrophic bacteria and archaea in anoxic and oxic environments. The NRBA are found in the highest concentration in the anoxic environments within close proximity to the fermentation layer, where their food, acetic acid, is created. When carbon dosing occurs, NRBA populations can expand into oxic areas in contact with the water column, where they can extract acetic acid.
NRBA will compete with other bacteria and archaea for acetic acid. This process will raise the oxygen (O2) demand in the system and also increase CO2 production. Ensuring the system has good surface agitation for gas exchange will eliminate the risk of low oxygen for animals.
Dosing
The total daily manual dose amount should be administered shortly after the lights come on. Automated micro-dosing with a dosing pump throughout the day is the least time-consuming method. Directly dose into a high-flow area to ensure the organic carbon dilutes instantly. Splitting the dose into multiple manual micro-doses throughout the day isn't necessary and can make it cumbersome to manage. Keeping manual dosing to a single morning dose is a recommended approach for a few specific reasons:
- Maximizing Oxygen Safety: Heterotrophic bacteria and archaea consume a large amount of dissolved oxygen as they metabolize organic carbon. During the day, gas exchange is highly efficient, and if the system has aquatic plants, they are actively producing oxygen. Dosing in the morning ensures the bacteria and archaea don't deplete the tank's oxygen at night, when levels naturally drop.
- Managing pH: White vinegar is acidic and will cause a minor, temporary dip in pH right after it enters the water. Dosing in the morning aligns with the period when the system's pH is naturally at its lowest baseline and beginning its daily upward climb, making the minor temporary dip much easier for the system's natural buffering capacity to absorb. Lab testing showed this temporary pH dip recovers in 2 to 3 hours.
Adding too much carbon at the start of a dosing schedule can cause excessive growth of heterotrophic bacteria in the water column, resulting in cloudy water. This is temporary and does not harm the animals.
Start with a small dose to slowly grow the NRBA population, then ramp up over three weeks to reach the amount needed to reduce and maintain the desired NO3 level.
The amount of carbon to dose will vary from system to system. By adjusting the dose up or down, it will be possible to maintain NO3 near 0 ppm.
The initial dosing schedules provided are conservative and are intended only as a general guide, not a hard-set rule. All systems are different, and in many cases the system maintenance dose will end up many multiples higher than what the initial dosing schedules state.
Effect on Phosphate
Dosing an organic carbon solution does not add or increase phosphate in the aquarium. In fact, it does the opposite: it helps lower phosphate levels. One exception is the “Nitrate Limitation” bottleneck.
Carbon Dosing Removes Phosphate
The heterotrophic bacteria and archaea that feed on organic carbon don't just consume it; they require a balanced diet of carbon (C), nitrogen (N), and phosphorus (P) to build their cells and multiply.
To build new bacterial and archaeal biomass, the bacteria and archaea absorb these elements from the system water in a specific biological ratio (often referred to in marine biology as a variation of the Redfield Ratio):
- Organic Carbon + Nitrate (NO3) + Phosphate (PO4) → New Bacterial Biomass
As bacteria/archaea consume the organic carbon solution, they must extract nitrate and phosphate from the water column to grow.
Nitrate Limitation Bottleneck
While carbon dosing lowers both nitrate and phosphate, bacteria and archaea consume significantly more nitrogen than phosphorus in the form of PO4. Typically, heterotrophic bacteria and archaea consume roughly 16 to 20 parts nitrate for every 1 part phosphate.
Because of this lopsided ratio, the system can run into a common scenario called Nitrate Limitation.
If the aquarium runs out of nitrate completely (NO3 hits 0 ppm), the bacteria and archaea stop multiplying, even if you continue dosing carbon.
Because the bacteria and archaea stop growing, phosphate removal will stall. With heavy fish feeding, phosphate levels can rise because the carbon dosing mechanism is locked out by the lack of nitrate.
This was observed in the first lab experiment using a sodium acetate trihydrate solution.
Phosphate Limitation
NRBA require a tiny amount of phosphate to process nitrate. If the system is completely bottomed out at 0.00 ppm phosphate, the nitrate reduction will completely stall.
Carbon Dosing Increases CO2 Production in the Substrate
Aquatic plant hobbyists also benefit from carbon dosing because it increases carbon dioxide (CO2) production in the substrate, particularly in low-oxygen (anoxic) zones where denitrification occurs.
For aquatic plant hobbyists who do not add CO2 gas to the system, the faster growth rate will be obvious. If the system already has a CO2 gas system, it may no longer be needed when carbon dosing.
Biological Mechanism for CO2 Production
When adding an organic carbon source, such as sodium acetate, ethanol, or white vinegar, to the water, a fuel source (electron donor) is provided for heterotrophic bacteria and archaea.
In the anoxic layers of the substrate, facultative anaerobic bacteria and archaea shift from using dissolved oxygen to using nitrate (NO3−) to break down organic carbon. This metabolic process is a form of cellular respiration. Just like human respiration, a primary byproduct of this cellular metabolism is CO2.
The simplified chemical progression looks like this:
- Organic Carbon Source + (NO3−) → Nitrogen Gas (N2) + Carbon Dioxide (CO2) + Water (H2O)
Impact on Substrate Chemistry
Because the substrate has a lower water turnover rate than the open water column, the CO2 produced by these expanding bacterial and archaeal colonies accumulates locally before diffusing out. This leads to a few distinct environmental changes within the substrate bed:
- Localized pH Drop: As the localized concentration of CO2 rises in the interstitial water (the water trapped between substrate grains), it reacts with water to form carbonic acid (H2CO3). This lowers the pH within the substrate, often making it significantly more acidic than the overlying water column.
- Mineral Solubilization: If the system uses a buffering or calcium-based substrate (such as aragonite or crushed coral), this localized pH drop can slowly dissolve the substrate, releasing calcium and carbonate ions into the water. In a freshwater setup with inert substrate, it simply creates an acidic micro-environment.
- Gas Pocket Formation: If carbon dosing is aggressive, visible gas bubbles can form against the glass in the deeper substrate layers. While some of this is harmless nitrogen gas (N2) from successful denitrification, some is trapped CO2.
Safety of CO2 Production in the Substrate
In most well-maintained setups, this localized CO2 production is harmless and safely diffuses out of the substrate into the water column, where it either gasses off at the surface or is consumed by aquatic plants.
However, because carbon dosing accelerates this process, it underscores the need for vigorous surface agitation in the main system. If CO2 diffuses out of the substrate and the water column lacks adequate gas exchange, it can cause a systemic drop in the tank's overall pH and a dangerous depletion of dissolved oxygen (O2) for the livestock.
Organic Carbon Dosing is Safe For Increasing CO2
Using any of the three organic carbon sources outlined in this research to increase CO2 production is safer and more effective than adding glutaraldehyde (e.g., Seachem Flourish Excel). Because the system produces more natural biological CO2, aquatic plants will consume macro- and micro-nutrients faster. Carbon dosing may require the application of macro- and micro-fertilizers in the aquatic plant system.
The Dosing Schedule
Heterotrophic bacteria and archaea multiply rapidly. Dose in the morning after the lights have turned on. Carbon dosing increases CO2 production, which lowers pH, but photosynthetic plants consume the CO2 and release oxygen, which many heterotrophic bacteria and archaea species need, thereby raising pH. The daylight cycle balances the carbon dosing effect on pH. To prevent sudden oxygen depletion or a white bacterial bloom in the display tank, ramp up the dose gradually using a conservative schedule:
- Week 1: Days 1 to 3, dose the starting amount daily; double for days 4 to 7.
- Week 2: Double the daily dose (only if nitrates haven't dropped yet).
- Week 3: Increase by an additional 50% if needed.
Finding the "Maintenance Dose"
Test the nitrate (NO3) and phosphate (PO4) levels twice a week. Once the NO3 drops to the target level (e.g., 2–5 ppm), reduce the dose. This becomes the long-term maintenance dose. If nitrates begin to creep back up, increase the dose slightly; if they drop to absolute zero, scale back further.
Crucial System Requirements: When dosing an efficient carbon source, the tank's bacterial and archaeal population will consume a significant amount of oxygen. The system must have strong surface agitation to maintain dissolved oxygen levels.
Watch for Bacterial Mats: If a white, snot-like film forms on the glass, pumps, or plumbing, it indicates dosing too much, too fast. Cut the dose back by 50% immediately and let the system clear up.
The best application of the sodium acetate trihydrate (SAT) solution is in systems housing aquatic organisms that prefer hard and alkaline water.
Many online sources sell sodium acetate trihydrate. 500 grams can be found for under US$20. One gallon (3.8 L) of distilled water sells for less than US$2.
Sodium acetate trihydrate (C2H3O2Na.3H2O) as a carbon source for denitrification in aquatic systems was used in the scientific research paper by Daisuke Tanikawa, Yuka Nakamura, Hiromi Tokuzawa, Yuga Hirakata, Masashi Hatamoto, Takashi Yamaguchi, Effluent treatment in an aquaponics-based closed aquaculture system with single-stage nitrification–denitrification using a down-flow hanging sponge reactor[4]. This paper made it a candidate for an additional study in the aquarium lab experiments for this publication.
Sodium acetate is a chemical compound made up of three primary chemical elements: carbon, hydrogen, oxygen, and sodium.
Chemically, it is classified as an alkali metal salt of acetic acid. Its chemical formula is CH3COONa (sometimes written as NaC2H3O2).
Sodium Acetate Chemical Blueprint (The Ions)
Sodium acetate is held together by an ionic bond between two distinct parts:
- The Sodium Ion (Na+): A positively charged alkali metal ion.
- The Acetate Ion (CH3COO-): A negatively charged polyatomic organic ion.
Sodium Acetate Molecular Composition
If the molecule of anhydrous (dry) sodium acetate is broken down into its individual atoms, it contains the following:
- 2 Carbon atoms
- 3 Hydrogen atoms
- 2 Oxygen atoms
- 1 Sodium atom
Because sodium and oxygen atoms are much heavier than hydrogen atoms, carbon and oxygen actually make up the vast majority of the compound's physical mass.
Hydrous vs. Anhydrous (Water Content)
Depending on how it is prepared, sodium acetate usually exists in one of two forms:
- Anhydrous Sodium Acetate: Pure, dry sodium acetate with no water trapped in its crystalline structure. It is a fine, white, moisture-absorbing powder.
- Sodium Acetate Trihydrate (CH3COONa · 3H2O): This is the most common form. For every one molecule of sodium acetate, three molecules of water are chemically bound inside the crystal lattice. This form appears as large, clear, needle-like geometric crystals or as a coarse white powder.
What is Sodium Acetate Made From?
Sodium acetate is what forms when vinegar, which is roughly 5% to 8% acetic acid in water, is neutralized with a sodium-based alkaline base.
In a lab or industrial setting, it is often made using high-purity acetic acid and sodium hydroxide (lye) or sodium carbonate (washing soda). In a simple kitchen experiment, it is the substance left in the liquid after mixing baking soda (sodium bicarbonate) and white vinegar and letting the fizzing carbon dioxide gas escape.
To create a food solution for NRBA, use Sodium Acetate Trihydrate (SAT) and distilled water or reverse osmosis (RO)/deionized (DI) water.
The Effect of Sodium Acetate on Water Chemistry
SAT adds sodium to the system, so expect the total dissolved solids (TDS) to increase over time. SAT will increase KH significantly. Long-term (months) use of SAT without water changes to reduce sodium in the aquarium/pond could become toxic for plants. High KH could also become an issue if it is not monitored and diluted with water changes as needed.
No adverse effects from SAT dosing were observed in freshwater fish, snails, or aquatic plants during experiments.
Monitor the Total Dissolved Solids (TDS) and KH while using SAT. Determine acceptable sodium and KH levels for the system's aquatic life. Create a water-change schedule to keep sodium and KH within acceptable limits.
SAT Solution
The effectiveness of SAT solutions can be affected by the growth of heterotrophic bacteria and archaea in the solution. Because of this, it is recommended to make no more than two weeks' worth of dosing at a time.
Mixing SAT with 15% by volume of 80 proof ethanol (40% alcohol) will preserve the solution and add additional carbon. Keep the container tightly sealed to prevent the ethanol (preservative) from evaporating. This solution can be stored long-term and is a better option for larger batches. This will significantly increase the carbon content in each dose.
If a clear bottle is used for the solution and white tufts are observed at the bottom, this indicates heterotrophic bacteria and archaea forming in the solution, especially if the mixture contains no ethanol to act as a preservative. This was observed in the lab during the first experiment, with the first batch of SAT solution prepared.
Why Bacteria Love Clean Sodium Acetate
Sodium acetate is a high-energy organic carbon source. Heterotrophic bacteria, archaea, and airborne mold spores view it as an all-you-can-eat buffet.
When SAT is mixed with pure water and no antimicrobial agent (ethanol) is included, microbes can be introduced from the air, mixing utensils, or the container itself. Over a few weeks, they multiply into visible, fuzzy white biofilms.
Toss out the contaminated batch, thoroughly sanitize the mixing container and measuring tools, and mix a fresh batch using pure distilled water.
Keeping a sealed bottle of SAT solution in the refrigerator will drastically slow or prevent microbial growth.
Sodium Acetate Trihydrate Formula
Small Batch Solution
- 10 g
- 100 mL of distilled or RO/DI water
Large Batch Solution
- 100 g
- 1 L of distilled or RO/DI water
Sodium Acetate Dosing
Dosing Schedule for 40 Liters (10 gallons).
Using the sodium acetate trihydrate solution, follow this very conservative ramp-up schedule to avoid a bacterial and archaeal bloom or oxygen crash. Depending on how fast NO3 accumulates in the system, systems that gain 40 ppm or more per week may require four times (4X) or more SAT solution to maintain the desired nitrate level.
| Timeframe | Daily Dose (mL) | Purpose |
|---|---|---|
| Days 1–3 | 1 mL | Acclimation |
| Days 4–7 | 2 mL | Establishing colony |
| Week 2 | 4 mL | Increasing bacterial load |
| Week 3 | 8 mL | Ramp-up (+2 mL/week thereafter) |
Adding Ethanol to Preserve the SAT Solution
To reliably preserve an organic carbon solution and prevent microbial growth, add at least 15% ethanol by volume. One liter of 80 proof vodka has about 9 times as much carbon as 100 grams of SAT dissolved in 1 liter of distilled water.
Combining ethanol with sodium acetate trihydrate will drastically increase the fluid's carbon density. To ensure accurate dosing, it helps to look at the relative carbon output of each component:
- Vodka (40% Ethanol): Standard 80 proof vodka contains approximately 160 grams of pure organic carbon per liter.
- Sodium Acetate Trihydrate: Contains roughly 17.6% organic carbon by weight.
If 100 grams of sodium acetate trihydrate is dissolved directly into 1 liter of vodka, an extra 17.6 grams of organic carbon is added. This increases the total carbon density by roughly 11%, shifting the dose's metabolic profile toward acetate-preferring bacteria.
Since standard 80 proof vodka is only 40% ethanol, a tiny splash will not be sufficient to preserve the SAT solution. The vodka should make up 37.5% of the bottle's total liquid volume.
Practical Tips for Mixing
Watch the pH: Sodium acetate is a basic salt. Dissolving a large amount into vodka will raise the solution’s pH (typically to around 8.5–9.0). This won't affect its use as a carbon source, but measure alkalinity (KH) regularly.
Add Slowly: Because the trihydrate form releases its own crystalline water, add the crystals to the vodka in stages while stirring. If too much is added too quickly, the sudden local drop in alcohol concentration can cause minor temporary clumping before it fully clears.
Storage: Keep the final mixture in a tightly sealed container. Ethanol evaporation will change the concentration and can cause the remaining sodium acetate to precipitate out of the solution over time.
Here are the precise measurements for common container sizes:
| Total Desired Solution | 40% Vodka Needed | SAT Solution |
|---|---|---|
| 100 mL | 37.5 mL | 62.5 mL |
| 250 mL | 93.75 mL | 156.25 mL |
| 500 mL | 187.5 mL | 312.5 mL |
| 1 Liter (1000 mL) | 375 mL | 625 mL |
The entire ethanol molecule (C2H5OH), which contains carbon, evaporates very easily into the air. Unlike ethanol, sodium acetate is a salt. Salts have very high boiling points and do not evaporate at room temperature. If all the water and ethanol evaporate, white sodium acetate crystals remain at the bottom of the bottle. As long as the container has a tight seal, the molecules will remain trapped in the liquid, keeping the carbon density stable and the fluid protected against bacteria.
The carbon density in the ethanol (60 grams)/SAT (11 grams) solution (71 grams of carbon per liter) is much higher than that of the SAT solution alone (17.6 grams of carbon per liter). Use about 1/5 the dose of this solution.
SAT/Ethanol Dosing
Dosing Schedule for 40 Liters (10 gallons).
When dosing the ethanol/sodium acetate solution, follow this conservative ramp-up schedule to avoid a bacterial bloom or an oxygen crash.
| Timeframe | Daily Dose (mL) | Purpose |
|---|---|---|
| Days 1–3 | 0.25 mL (5 drops) | Acclimation |
| Days 4–7 | 0.5 mL (10 drops) | Establishing colony |
| Week 2 | 1 mL (20 drops) | Increasing bacterial load |
| Week 3 | 1.3 mL | Ramp-up (+2 mL/week thereafter) |
The alcohol in vodka is ethanol, which typically accounts for 40% of the liquid by volume (standard 80 proof). Vodka is highly distilled and filtered; it contains almost no impurities, residual sugars, or flavorings, leaving a pure blend of ethanol and water.
Ethanol has a slower initial lag time in delivering carbon but exhibits highly accelerated growth once established. Before NRBA can use vodka for denitrification, it must first be oxidized into acetaldehyde and then into acetate. While this conversion happens very quickly, it introduces a short-term delay compared to dosing raw acetate or white vinegar. Once the specific bacterial and archaeal colonies adapt, ethanol becomes an extremely aggressive food source.
Vodka is a low-cost source of organic carbon. A 1.7 liter bottle of Kirkland 80 proof American Vodka sells for less than US$12.
Ethanol Toxic Intermediates
When ethanol is metabolized, it produces acetaldehyde as a transient intermediate. Acetaldehyde is notoriously toxic to aquatic life and can inhibit certain bacterial and archaeal populations if it accumulates.
While a healthy, established biofilm processes it quickly, any sudden overdose or system imbalance that causes ethanol to stall at the acetaldehyde stage can shock a sensitive aquatic ecosystem. Sodium acetate and white vinegar bypass this intermediate entirely.
Chemical Makeup of Ethanol
Ethanol's chemical makeup consists of three elements: carbon (C), hydrogen (H), and oxygen (O).
Its chemical formula can be written in a few different ways:
- Molecular Formula: C2H6O (This shows the total count of each atom.)
- Condensed Structural Formula: CH3CH2OH (This gives a better idea of how the atoms are arranged.)
Ethanol Atomic Breakdown
Every single molecule of ethanol contains exactly 9 atoms:
- 2 Carbon atoms forming a short backbone.
- 6 Hydrogen atoms bound to the carbons and the oxygen.
- 1 Oxygen atom bound to a hydrogen, forming a hydroxyl group.
Chemical Structure
Structurally, ethanol is divided into two distinct parts:
The Ethyl Group (CH3CH2−): This part behaves like a hydrocarbon chain. It is hydrophobic (water-fearing) and allows ethanol to mix well with organic substances such as fats and oils.
The Hydroxyl Group (-OH): This functional group classifies ethanol as an alcohol. Because oxygen is highly electronegative, this group is polar. It forms hydrogen bonds with water, which is why vodka and other spirits can mix perfectly with water without separating.
Ethanol (Vodka) Dosing
Dosing Schedule for 40 Liters (10 gallons).
When dosing the ethanol, follow this conservative ramp-up schedule to avoid a bacterial bloom or an oxygen crash.
| Timeframe | Daily Dose (mL) | Purpose |
|---|---|---|
| Days 1–3 | 0.25 mL (5 drops) | Acclimation |
| Days 4–7 | 0.5 mL (10 drops) | Establishing colony |
| Week 2 | 1 mL (20 drops) | Increasing bacterial load |
| Week 3 | 1.3 mL | Ramp-up (+2 mL/week thereafter) |
When comparing ethanol (80 proof vodka) to sodium acetate for driving anaerobic denitrification, both are highly efficient, pure, and easily metabolized by heterotrophic bacteria. Because they bypass complex sugar pathways, they drastically reduce the risk of intermediate nitrite (NO2-) accumulation during breakdown.
However, they differ in metabolic rate, kinetic stability, safety, and impact on water chemistry.
In the context of supporting heterotrophic NRBA, "effectiveness" depends on how readily they can break down the molecule to extract electrons, which they use to convert nitrate (NO3-) into harmless nitrogen gas (N2).
Metabolic Efficiency
Ethanol has a higher energy density and a more direct pathway into the metabolic cycles of a wide variety of denitrifying bacteria and archaea. Here is a direct comparison of how these two carbon sources perform in a biological system:
- Ethanol: Slightly slower initial lag time, but highly explosive growth once established. It is a highly volatile, easily transportable molecule that passes effortlessly through bacterial cell membranes. Once inside, it is rapidly oxidized into acetaldehyde, then acetate, and finally enters the citric acid cycle. Because it is readily accessible, heterotrophic bacteria and archaea respond to it almost instantly. This makes ethanol highly effective at rapidly knocking down high nitrate spikes.
- Sodium Acetate: Faster initial kinetics. Acetate is a direct, primary volatile fatty acid. Heterotrophic bacteria and archaea do not need to convert it; it is immediately ready for the citric acid cycle (Krebs cycle). Studies in both wastewater management and advanced aquarists show that sodium acetate yields very rapid denitrification rates because the bacteria and archaea expend no metabolic energy breaking the molecule down.
Yield and Consumption Ratios
Because of their different chemical structures, they yield varying amounts of "reducing power" (electrons) per molecule during denitrification.
The simplified biochemical pathways show the following electron yields:
- 1 mole of Ethanol (C2H5OH) → yields 12 electrons
- 1 mole of Acetate (CH3COO-) → yields 8 electrons
Because ethanol provides more electrons per molecule, less ethanol is physically needed by weight to reduce the same amount of nitrate than would be needed with sodium acetate.
Risk of Bacterial Blooms
While ethanol's carbon density makes it highly effective, that can sometimes be a double-edged sword.
Ethanol: Higher risk of targeted bacterial blooms. Because ethanol is highly bioavailable and easily diffused across cell membranes, an accidental overdose can trigger a massive bacterial bloom in the water column.
Sodium Acetate: Lower risk of water column blooms. Sodium acetate tends to be utilized more locally by the biofilm in the filter media, plenum, or deep substrate layers. It is less likely to cause the milky water column blooms associated with heavy ethanol dosing.
Impact on Water Chemistry (pH & Alkalinity)
Sodium Acetate: Alkalinizing. Sodium acetate is the sodium salt of acetic acid. When NRBA consume acetate ions during denitrification, the resulting sodium ions can affect water chemistry. The biological consumption of an organic acid salt removes hydrogen ions (H+), which can help maintain or raise alkalinity and pH over time.
Ethanol: Acidifying. As bacteria and archaea oxidize ethanol into acetate, it temporarily produces intermediate acidic byproducts. Combined with localized CO2 production from respiration, ethanol dosing exerts a greater downward pressure on the system's pH than sodium acetate.Preparation, Storage, and Stability
Sodium Acetate (Dry Powder): Excellent shelf life and high precision. Usually purchased as a dry crystalline powder (sodium acetate trihydrate), it has an indefinite shelf life, does not evaporate, and doesn't spoil. Sodium acetate can be weighed to the milligram on a milligram scale to create exceptionally precise DIY stock solutions.
Ethanol (Liquid): Evaporation and safety concerns. Pure ethanol and standard vodka are both highly volatile liquids. If the dosing container is not completely airtight, the alcohol will slowly evaporate, altering the solution's concentration. It is also inherently flammable, which requires specific storage precautions when kept in large quantities.
White vinegar (acetic acid) can support anaerobic denitrification. White vinegar is one of the most popular and accessible carbon sources used by advanced aquarists and water treatment operators.
Using white vinegar is chemically very similar to using sodium acetate.
White vinegar does not significantly affect a system's KH, GH, or TDS.
White vinegar (5%) is commonly available in grocery stores for cooking. For this lab experiment, 5% white vinegar was used. Stronger concentrations of white vinegar are available, but they must be handled carefully, as they can be hazardous and require special safety gear and ventilation precautions.
White vinegar (5%) can be purchased for as little as US$5 per gallon (3.78 L) at a grocery store.
Acetic Acid Evaporation
Acetic acid does evaporate. At room temperature, pure acetic acid is a clear liquid that slowly evaporates. Like water, it has a noticeable vapor pressure, meaning its molecules can escape from the liquid phase into the air. This evaporation causes the vinegar smell as soon as the container is opened.
How Acetic Acid Evaporates
Compared to water, acetic acid evaporates at a slightly slower rate under identical conditions because it has a higher boiling point and lower vapor pressure:
- Water Boiling Point: 100°C (212°F)
- Acetic Acid Boiling Point: 118°C (244°F)
Because the boiling points are relatively close, when a vinegar solution evaporates, both the water and the acetic acid evaporate together.
Key Factors Affecting Evaporation
- Evaporation & Dilution: If the bottle is left unsealed, water and acetic acid will evaporate at slightly different rates, which can alter the concentration. Additionally, if water is accidentally introduced into the bottle, the acidity could be diluted below the 4% threshold, making it susceptible to spoilage.
- Temperature & Airflow: Like water, higher temperatures or a breeze will significantly accelerate evaporation.
White Vinegar Chemistry
Household white vinegar is typically a 5% solution of acetic acid (CH3COOH or C2H4O2). When white vinegar enters the system's water, the acetic acid quickly dissociates into acetate ions (CH3COO-) and hydrogen ions (H+).
One liter of 5% white vinegar contains about 20 grams of elemental carbon, making it slightly denser than the SAT 100 g/1 L solution (17.6 grams).
Acetic Acid Molecular Composition
Acetic acid has eight (8) atoms total per molecule:
- 2 Carbon atoms: One in the methyl group (CH3), one in the carboxyl group (COOH).
- 4 Hydrogen atoms: Three attached to the methyl carbon, one acidic proton attached to oxygen.
- 2 Oxygen atoms: One double-bonded to carbon (C=O), one single-bonded (C-O-H).
White Vinegar Organic Carbon
Because the bacteria and archaea are ultimately utilizing the acetate, white vinegar delivers the exact same metabolic benefits as sodium acetate:
- Direct Pathway: It enters the bacterial and archaeal metabolic cycle directly, bypassing the multi-step breakdown required by ethanol (vodka).
- No Toxic Intermediates: It skips the ethanol hazardous acetaldehyde step entirely.
- Controlled Growth: It results in cleaner bacterial and archaeal biomass and a lower risk of massive, oxygen-depleting blooms associated with ethanol dosing.
Key Considerations When Using White Vinegar
While it is highly effective, white vinegar has a couple of unique properties that need to be accounted for compared to sodium acetate or ethanol:
pH Suppression
Because white vinegar is an acid, dosing it will temporarily lower the water's pH. In a system with strong buffering capacity (> 4 dKH/72 ppm), this effect is usually negligible and temporary, as the bacteria and archaea consume the acetate and actually return alkalinity to the system through the denitrification process:
- 2NO3− + 10CH3COO- + 2H+ → N2 + 10CO2 + 6H2O
When dosing large amounts of white vinegar into a system with low alkalinity (< 2 dKH/36 ppm), the sudden introduction of acid will cause a sharp drop in pH.
Immediate Chemical Effect (Temporary pH Drop)
- pH: As soon as white vinegar is added to the water column, it releases free hydrogen ions (H+). This causes an immediate temporary drop in pH.
- KH: The incoming acetic acid reacts with the dissolved carbonate/bicarbonate ions (HCO3-) in water, the minerals that make up the KH (buffering capacity). This reaction neutralizes the acid and converts some bicarbonate into carbon dioxide (CO2) gas and water. Consequently, KH drops slightly as it buffers the initial acidity.
Long-Term Biological Effect (pH & KH Recovery)
Because white vinegar is used as a carbon source for heterotrophic bacteria and archaea, the chemical story doesn't end when added to the system:
- When NRBA consume acetate: As NRBA metabolize acetate and nitrate, the biological process consumes hydrogen ions and produces bicarbonate. Once the NRBA process the dose, the initial loss of KH and drop in pH are largely reversed. Full biological denitrification is a net-alkalinizing process.
Dosing Method & Buffering Capacity Matter
While the system eventually balances out, the initial acid spike is the notable part.
- Low-KH Water is Vulnerable: If the system has a very low natural KH (< 2 dKH/36 ppm), the water may lack the buffering capacity to absorb that initial dose of acetic acid. This can cause a sudden, severe pH crash before the bacteria and archaea ever get a chance to consume it.
- Slow Dosing is Critical: The immediate acid effect is why white vinegar is a good candidate for automated micro-dosing with a dosing pump throughout the day, rather than being added as a single bulk liquid dose.
- Oxygen Depletion: Beyond pH/KH swings, the rapid bacterial and archaeal growth from white vinegar consumes dissolved oxygen and produces CO2. Surface agitation can prevent a secondary pH drop driven by excess dissolved CO2.
Comparing to Sodium Acetate and White Vinegar
For biological benefits without the initial pH drop or KH consumption, sodium acetate is sometimes preferred. Because sodium acetate is the salt of acetic acid rather than the acid itself, it supplies the same acetate ion to feed NRBA without introducing free hydrogen ions that would lower pH
Dosing Concentration
Standard white vinegar is 95% water and only 5% acetic acid; it has much less carbon than 80 proof vodka. White vinegar has slightly more carbon than the 100 g/1 L SAT solution and can be dosed at the same amount and on the same schedule.
The required white vinegar dose is significantly larger than that of a small amount of ethanol to deliver the same amount of organic carbon.
The higher volume of white vinegar makes it easier to dose precisely than ethanol with an automated dosing pump, since small calibration errors won't lead to a massive accidental overdose.
Because every aquatic system has a unique bioload, starting nitrate concentration, and anoxic environment efficiency, no single universal dose exists. Instead, aim for a gradual ramp-up schedule. This allows the heterotrophic bacterial and archaeal population to multiply safely without stripping the water of oxygen or triggering a bacterial bloom.
White Vinegar Dosing
Dosing Schedule for 40 Liters (10 gallons).
When using white vinegar, follow this very conservative ramp-up schedule to avoid a bacterial and archaeal bloom or oxygen crash. Depending on how fast NO3 accumulates in the system, systems that gain 40 ppm or more per week may require four times (4X) or more white vinegar to maintain the desired nitrate level.
| Timeframe | Daily Dose (mL) | Purpose |
|---|---|---|
| Days 1–3 | 1 mL | Acclimation |
| Days 4–7 | 2 mL | Establishing colony |
| Week 2 | 4 mL | Increasing bacterial load |
| Week 3 | 8 mL | Ramp-up (+2 mL/week thereafter) |
| Feature | Ethanol (Vodka) | Sodium Acetate Trihydrate 100g/1 Liter Solution | White Vinegar |
|---|---|---|---|
| Reaction Speed | Once heterotrophic bacteria and archaea are established, it is Extremely Fast. | Moderate / Steady | Moderate / Steady |
| Electron Yield | High (12 e− per molecule) | Moderate (8 e− per molecule) | Moderate (8 e− per molecule) |
| Bacterial Diversity | Broad (Risk of single-strain monoculture) | Targeted (Promotes diverse denitrifiers) | Targeted (Promotes diverse denitrifiers) |
| Overdose Risk | Can lower pH due to oxidation stages and CO2 production in the substrate. | Structurally stable; will significantly raise alkalinity (KH). | Immediate temporary drop in pH. Drops KH slightly. pH recovers in 2 to 3 hours. |
| Effect on GH | No | No | No |
| Effect on PO4 | No | No | No |
| Effect on TDS | No | Yes, Significant. Adds sodium (Na). | No |
| Storage & Stability | Self-preserving. | Indefinite shelf-life as dry powder. As a solution, microbial degradation. | Self-preserving. |
| Metabolic Readiness | Delayed; must be oxidized to acetaldehyde, then acetate. | Immediate; enters the cycle directly as acetate. | Immediate; enters the cycle directly as acetate. |
| System Start-up Time | Slower; requires microbial adaptation period. | Very fast; universally utilized by denitrifiers.) | Very fast; universally utilized by denitrifiers. |
| Risk of Toxic Intermediates | Risk of temporary acetaldehyde accumulation. | None. | None. |
| Flammability | Yes) | No | No) |
| Carbon Evaporation | Yes | No | Yes |
| Carbon per Liter | 160 grams | 17.6 grams | 20 grams) |
| Overdose Risk | 160 grams | 17.6 grams | 20 grams) |
| Increase in Plant Growth Rate | Yes | Yes | Yes |
| Adverse Effect on Aquatic Life | No | No | No |
| Avg. Cost per Gram of Carbon | $0.05 | $0.27 | $0.07 |
When using an automated dosing pump, the dosing container must be near airtight to prevent evaporation. Ethanol is a cheap carbon source, a readily scalable liquid, and highly effective. Because ethanol has 8 to 9 times the carbon density of SAT or white vinegar, it must be dosed with care, as the risk of overdosing is much higher.
Sodium acetate is technically the cleaner electron donor than ethanol. Sodium acetate maximizes kinetic speed, reducing the risk of systemic tank cloudiness and enabling precise chemical control without lowering pH. SAT can significantly affect water chemistry (KH and TDS); therefore, it is not recommended for long-term dosing in most freshwater systems.
White vinegar is an excellent organic carbon source for small systems (under 200 L/50 g) dosing, but it can also evaporate. The temporary drop in pH upon dosing is notable; it quickly recovers within two to three hours. White vinegar does not significantly change KH, which is more concerning for physiological stress on animals than pH. No adverse effects were observed in the white vinegar lab experiments on animals or aquatic plants from the temporary pH dip. Previous aquarium lab experiments have shown that a natural daylight pH drift of 2.0 (e.g., 7.0 to 9.0) had no effect on animals.
All three carbon sources used in the lab experiments accelerated aquatic plant growth. None of the three carbon sources showed any adverse effects on aquatic life in the aquariums.
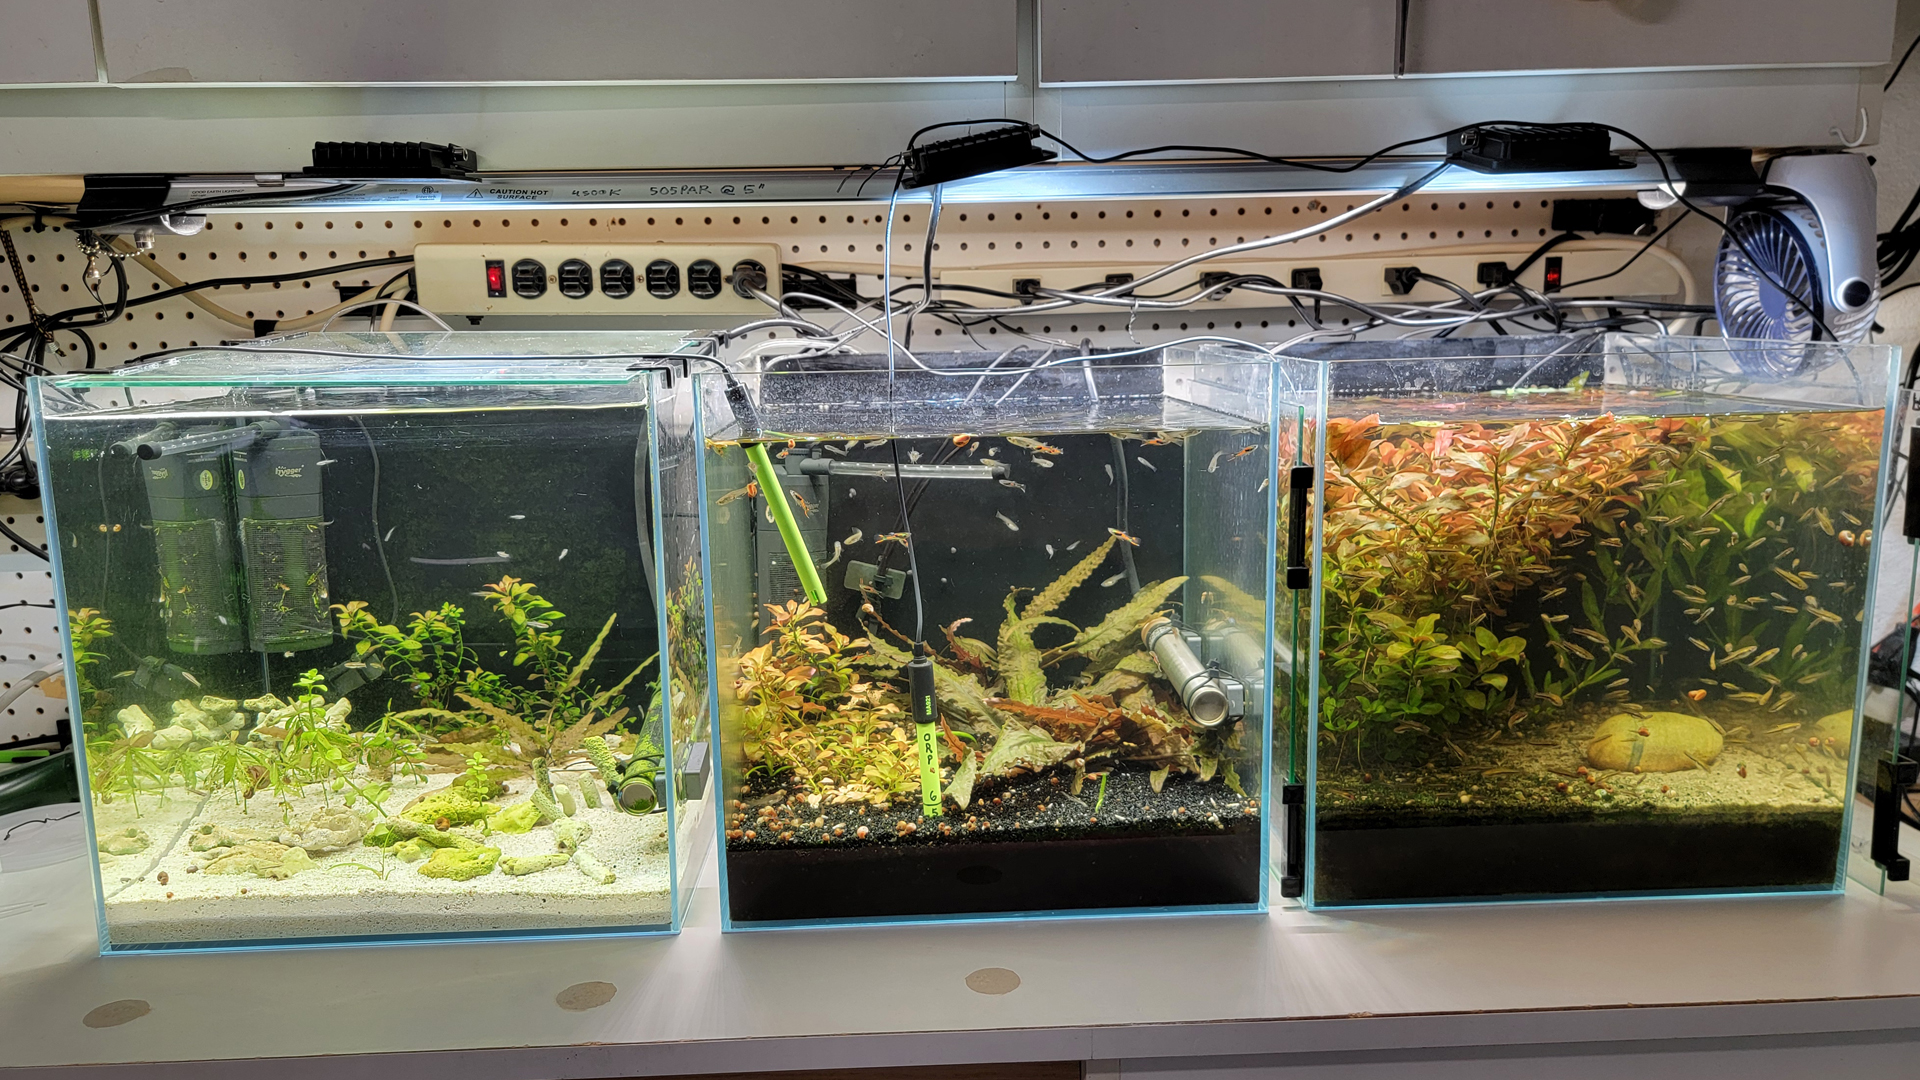
Each aquarium has about 31 L (8.25 gallons) of water above the substrate. The depth from the water surface to the top of the substrate is about 25.5 cm (11 inches).
The average temperature ranged from 27°C to 28°C (80°F to 82°F).
The water in all test systems had its GH increased with magnesium chloride and calcium chloride, and the KH increased with sodium bicarbonate.All systems were topped off with tap water due to evaporation. Tap water is low in KH (32 ppm), GH (50 ppm), and TDS (53 ppm), so topping off added a minor amount.
Lighting
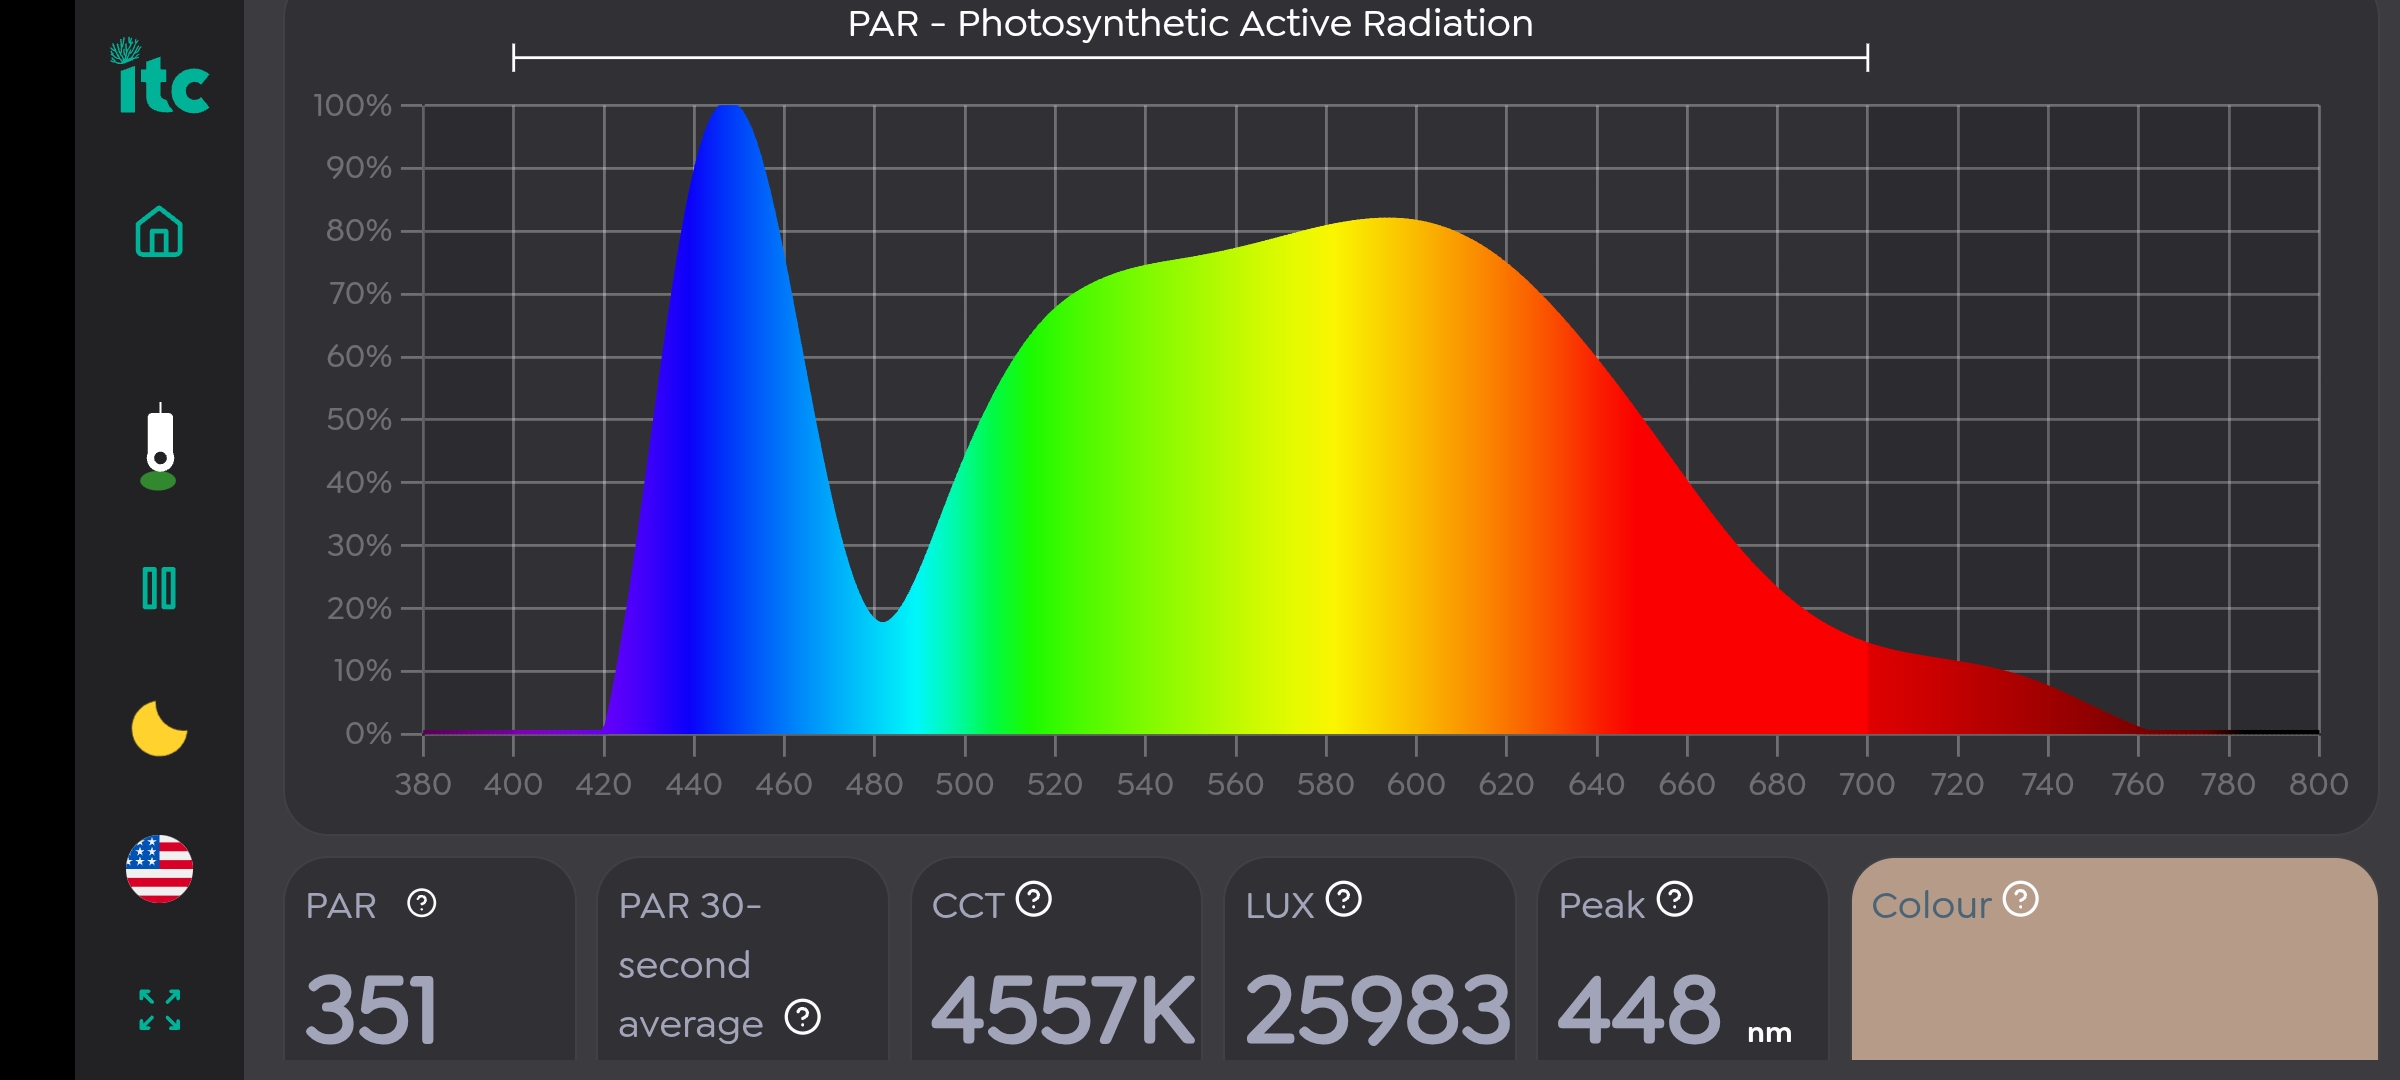
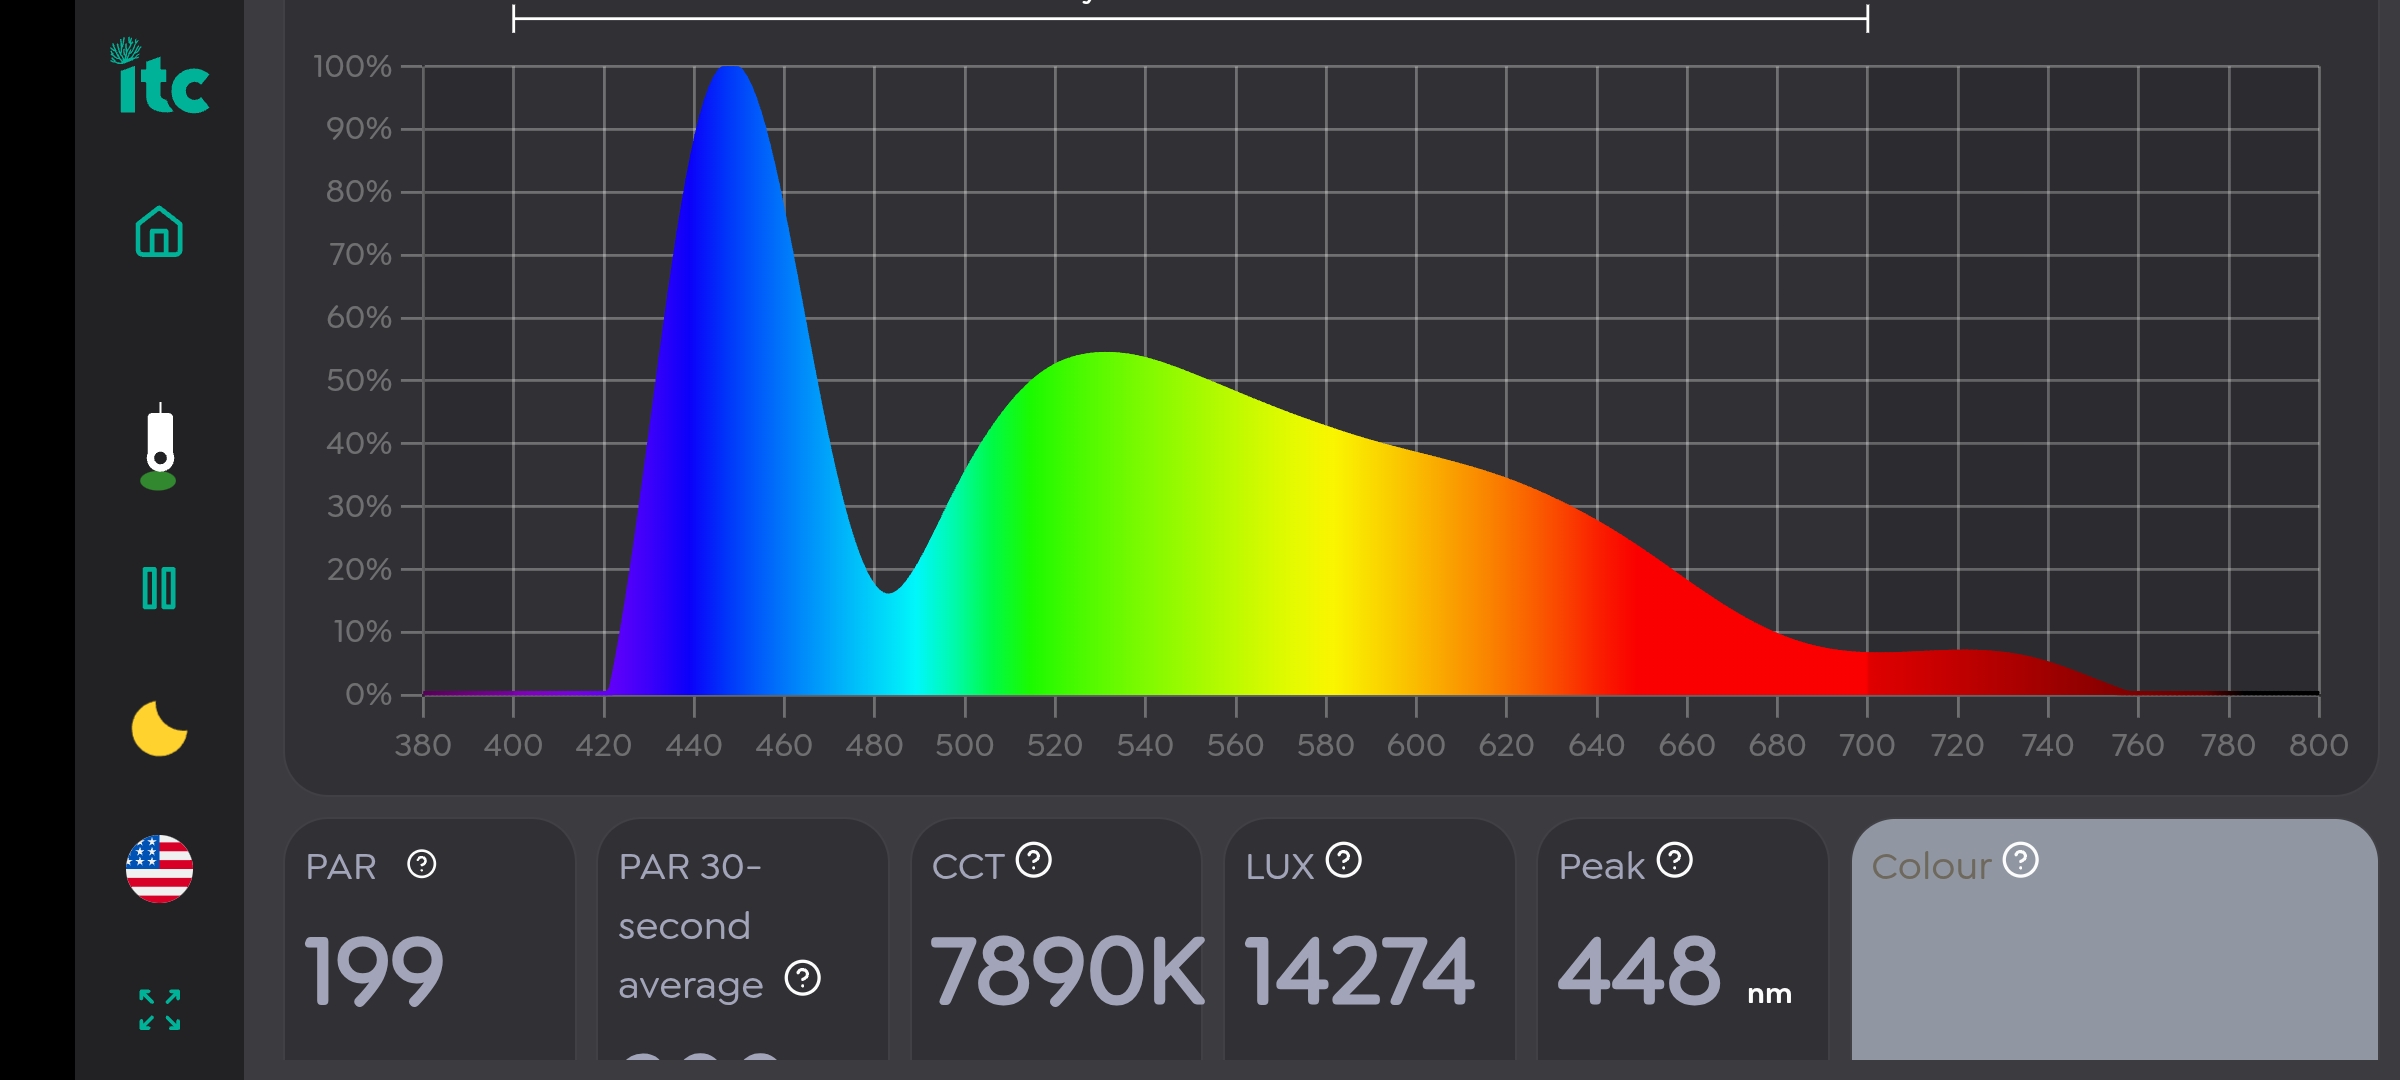
The lighting was provided by a Utilitech 85w LED shop light and a Miwat 20w LED flood light.
Aquatic Animals and Plants
The fish in the aquarium in the right tank are Heterandria formosa (least killifish), and the fish in the middle tank are Poecilia wingei (Endler’s livebearer).
The plants are Ludwigia repens, Sagitaria subulatta, Hygrophila polysperma, and Cryptocoryne wendtii.
The snails are Melanoides tuberculata (Malaysian trumpet snail [MTS] or Malaysian livebearing snail) and Planorbella duryi (Seminole ramshorn snail).
Filtration
The Hygger Aquarium Internal Power Filter HG-009-S (SKU: HGB009) provided filtration and current in each aquarium. The spray bar was aimed across the surface to maintain good surface agitation and current through the systems.
The filters were modified by super-gluing nylon screen over the intakes to prevent snails and small fish fry from entering the filters. The stock filter pads from Hygger were modified. The original polyester filter fiber and a small amount of activated carbon were removed. Custom-cut polyester fiber was wrapped around the filter frame for particulate (detritus) filtration only. No bio media or chemical filtration was used.
Test Equipment
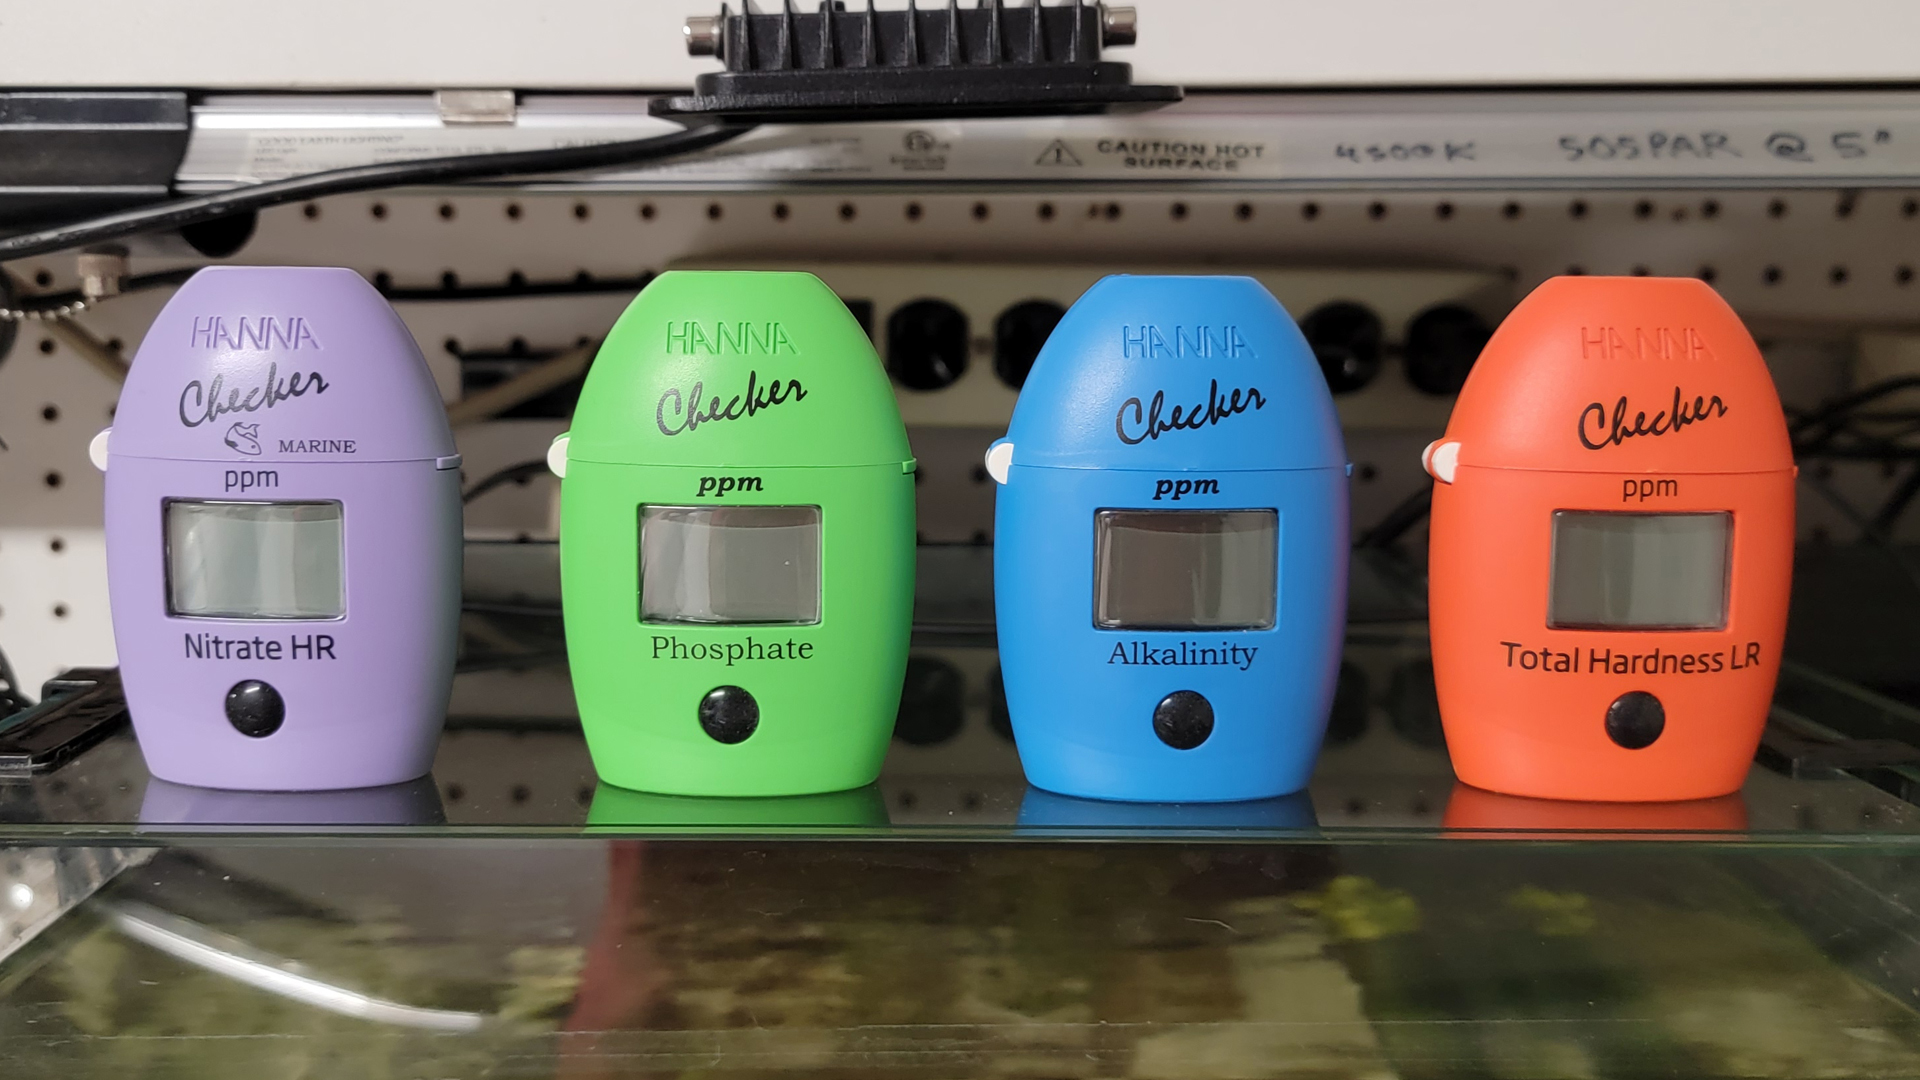
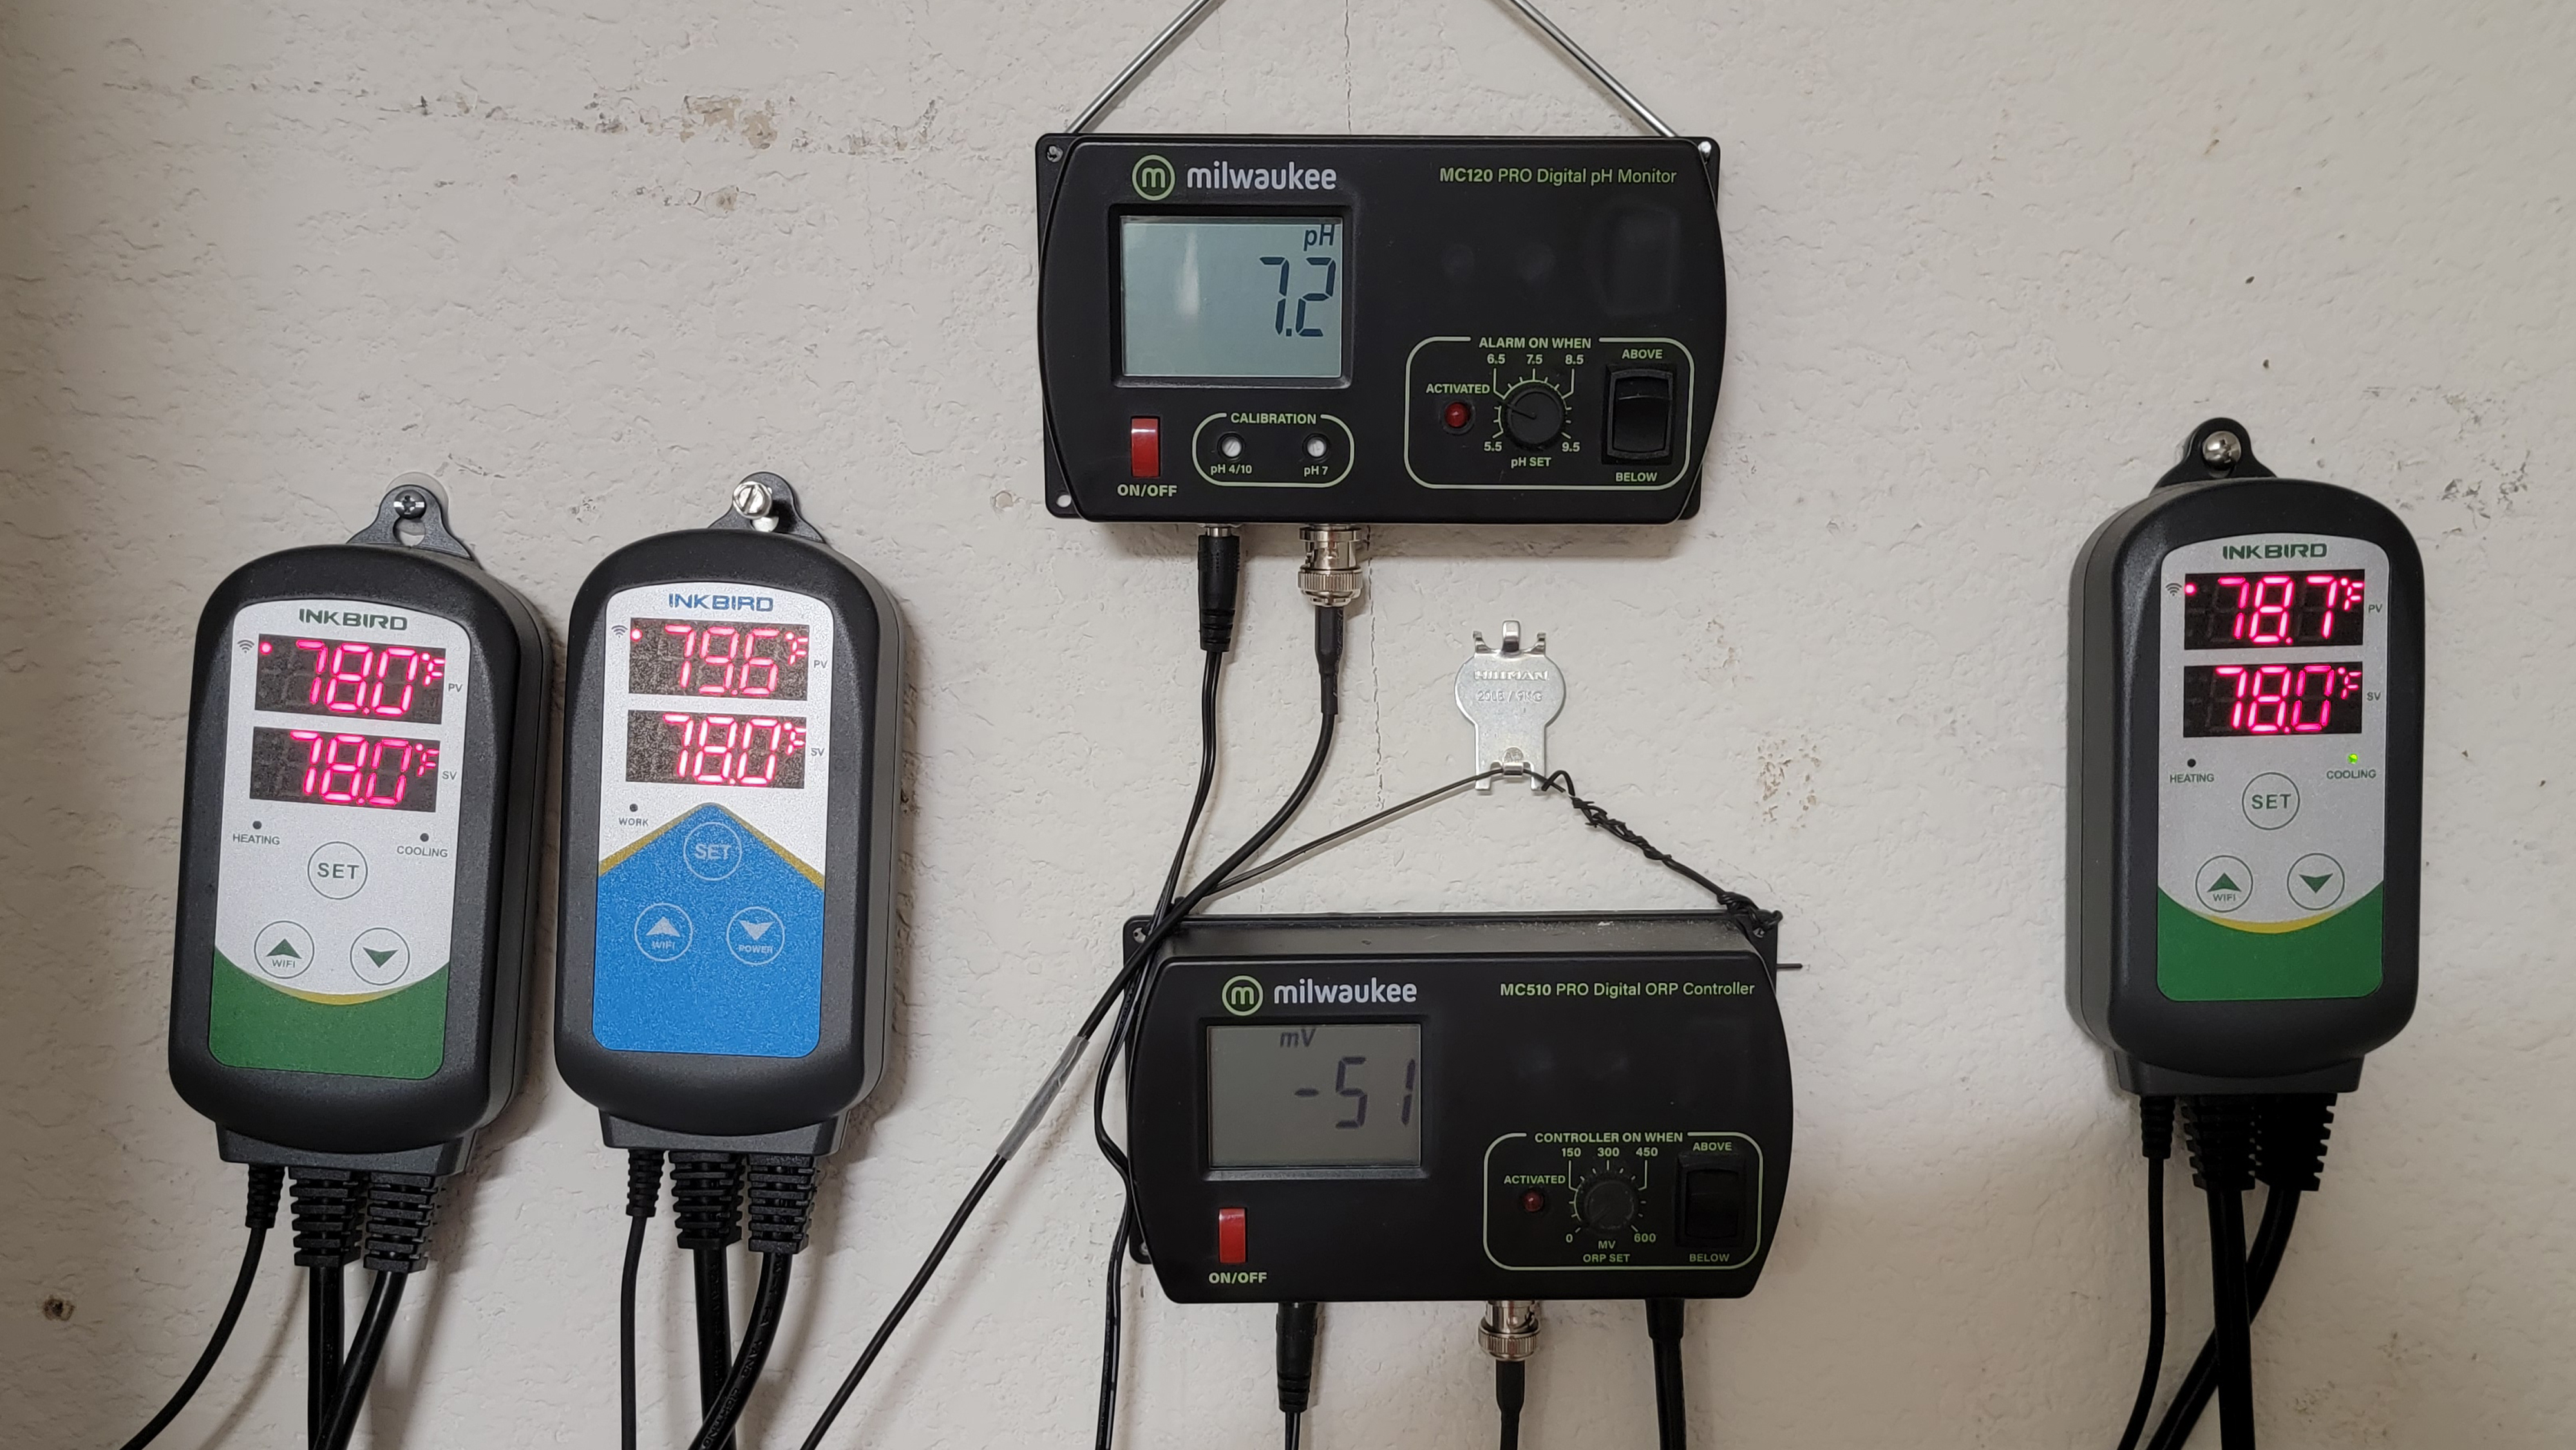
The following is a list of the equipment and test kits used to collect data:
- Hanna Marine Nitrate High Range Checker HC H1782 (works for freshwater)
- Hanna Low Range Phosphate Checker H1713
- Hanna Freshwater Alkalinity Colorimeter HI775
- Hanna Freshwater Hardness LR Colorimeter HI735
- Hanna TDS Tester HI98301
- Milwaukee MC120 Pro Digital pH Monitor
- Milwaukee MC510 Pro Digital ORP Controller
- InkBird ITC-308-WiFi and ITC-396A Temperature Controllers
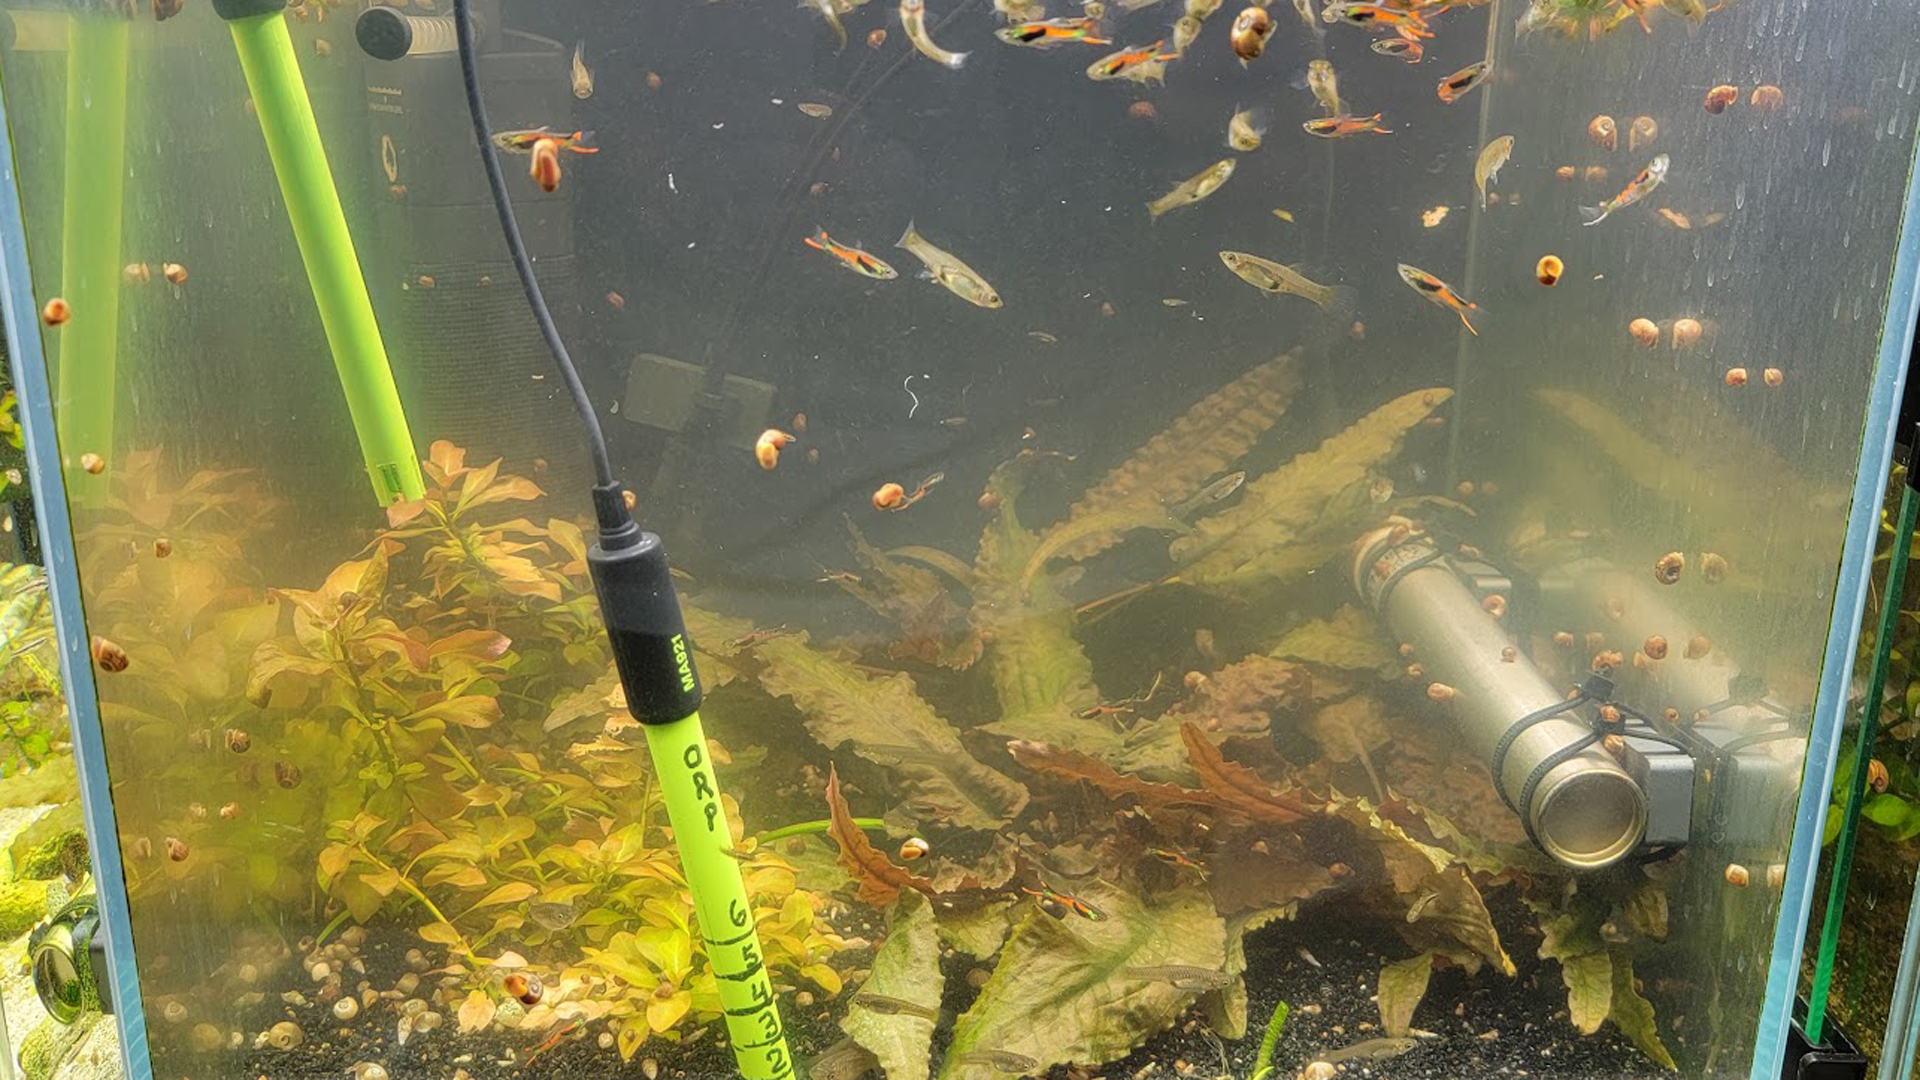
ORP data were collected in the middle tank using Black Diamond sand, as this data had not been collected in prior published research.
Sodium Acetate Trihydrate Solution Carbon Dosing
The first test was conducted in the right tank only using a sodium acetate trihydrate solution (100 g/L). The experiment duration was 30 days.
The system temperature ranged from 27°C to 28°C (80°F to 82°F).
Before dosing this system with the SAT solution, collected NO3 data showed it was accumulating at 3.73 ppm per day.
Initial dosing started at 0.5 mL four times a day (4X) and increased to 3 mL four times a day (12 mL total per day).
Twelve (12) mL per day decreased NO3 by an average of 3.1 ppm per day, for a total of 6.74 ppm per day of NO3 reduction when the increase in NO3 before SAT dosing is added to the daily NO3 decrease.
The effectiveness of the original batch of SAT solution declined as white, fluffy microbial mats formed at the bottom of the solution.
| Test | Start Value | End Value | Difference |
|---|---|---|---|
| NO3 | 28.8 ppm | 0 ppm | - 28.8 ppm |
| PO4 | 1.93 ppm | 4.2 ppm | + 2.27 ppm |
| pH | 7.4 | 7.9 | + .5 |
| KH | 119 ppm | 431 ppm | + 312 ppm |
| GH | 212 ppm | 192 ppm | - 20 ppm |
| TDS | 399 ppm | 694 ppm | + 295 ppm |
The excess PO4 was due to the Nitrate Limitation Bottleneck once all available NO3 was processed.
KH increased significantly by 312 ppm. With the increase in KH, the .5 increase in pH was expected.
GH decreased insignificantly by 20 ppm, some of which may have been due to aquatic plant and animal growth.
TDS changed significantly by 295 ppm, due to the sodium in the sodium acetate.
No aquatic plants, snails, or fish showed any observable stress from the SAT solution dosing. Aquatic plants had a noticeable increase in growth rate.
Ethanol (Vodka) Carbon Dosing
The second test was conducted in the middle and right tanks using ethanol (80 proof vodka). The system temperature ranged from 27°C to 28°C (80°F to 82°F). The experiment duration was 17 days.
Middle Tank Ethanol Test
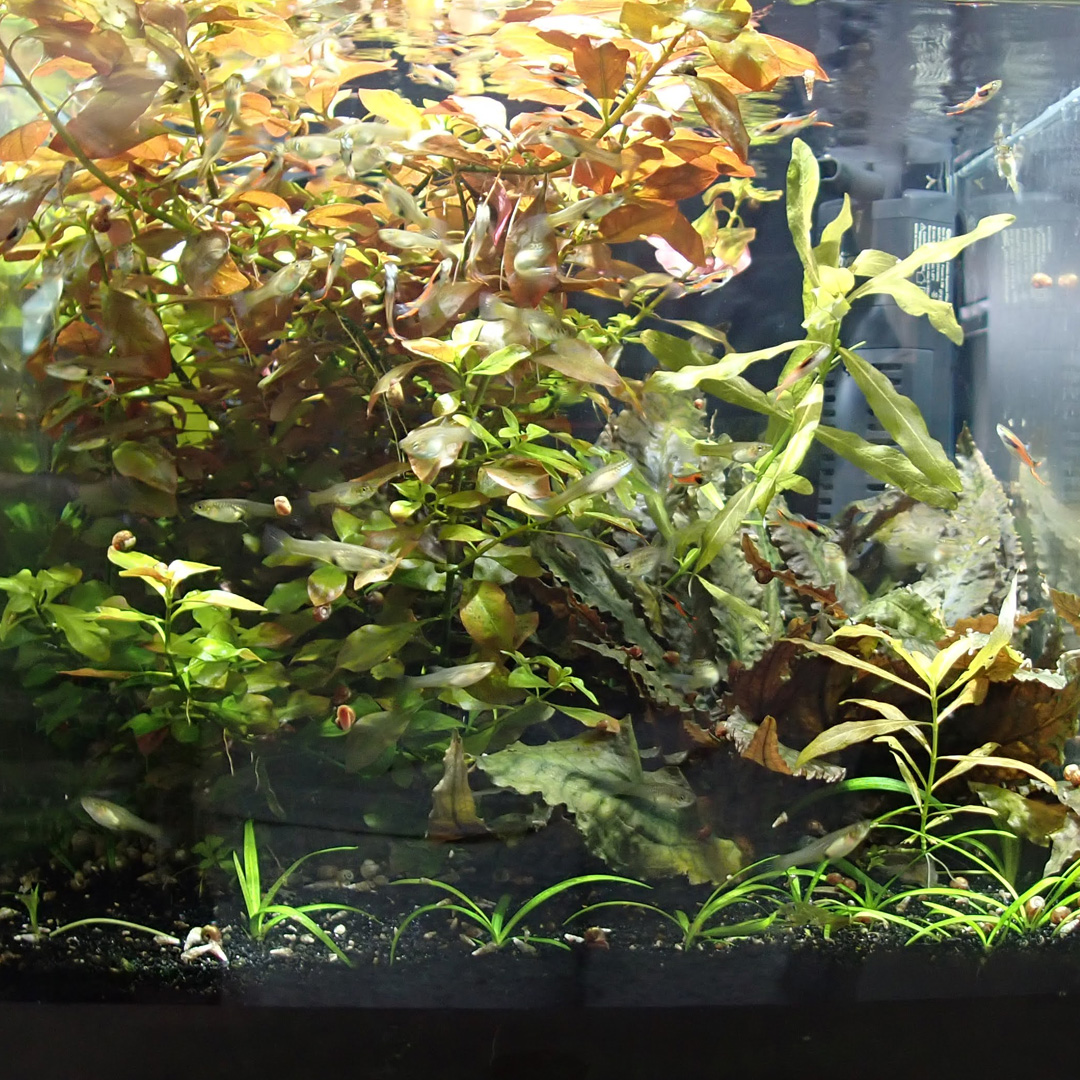
Middle tank values are as follows:
| Test | Start Value | End Value | Difference |
|---|---|---|---|
| NO3 | 13.9 ppm | 5.8 ppm | - 8.1 ppm |
| PO4 | .61 ppm | .45 ppm | - .16 ppm |
| pH | 7.4 | 7.2 | - .2 |
| KH | 109 ppm | 87 ppm | - 22 ppm |
| GH | 153 ppm | 144 ppm | - 9 ppm |
| TDS | 316 ppm | 289 ppm | - 27 ppm |
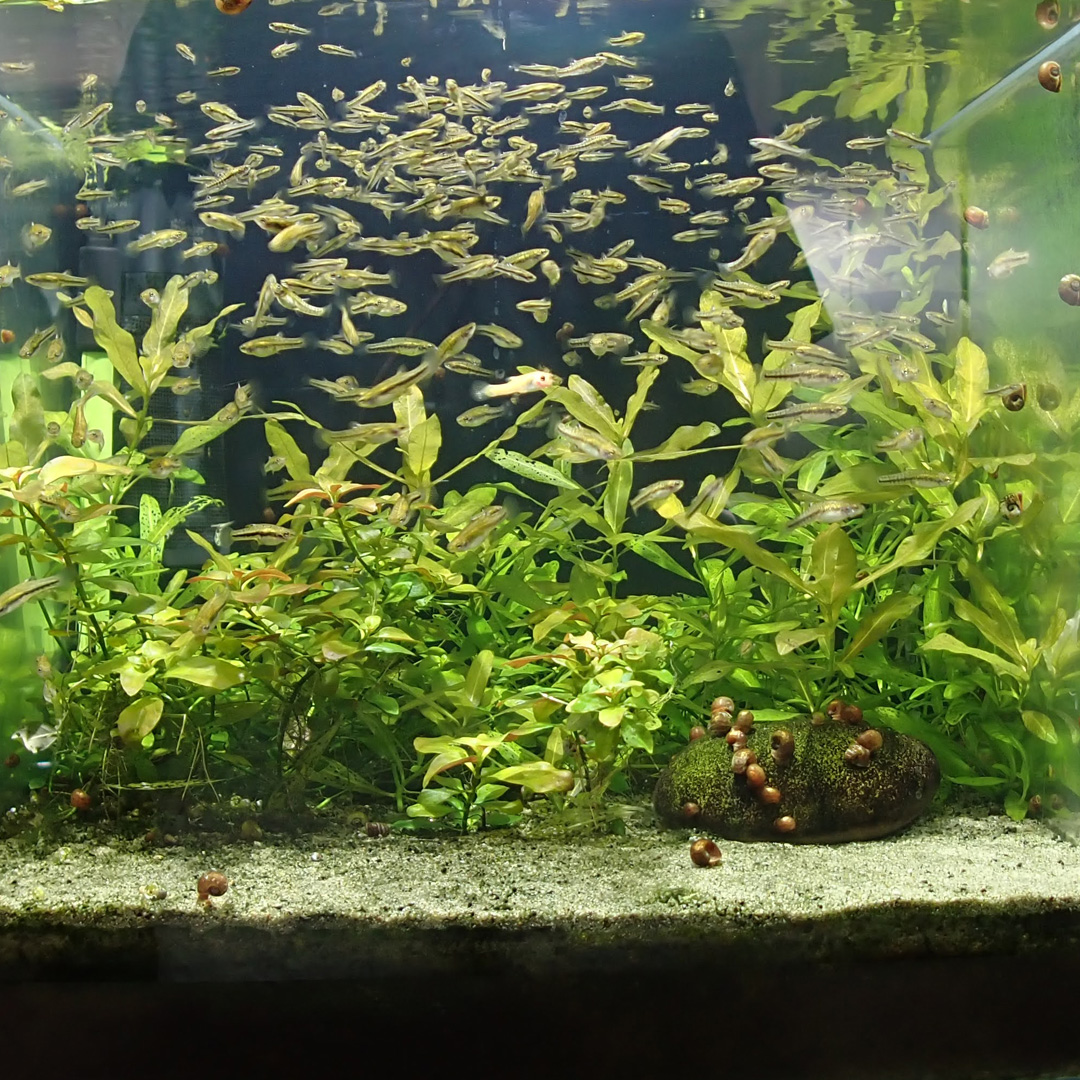
KH, GH, TDS, and pH changes are minor, but worth noting if a system goes months without a water change. Bacteria, archaea, and some aquatic plant species will use KH over time, so a regularly scheduled test is recommended to monitor and adjust as needed.
No aquatic plants, snails, or fish showed any observable stress from the ethanol dosing. Aquatic plants had a noticeable increase in growth rate.
The middle tank was tested long enough to determine a maintenance dose of about 1.25 mL of ethanol per day.
Right Tank White Vinegar Test
The right tank was tested long enough to find a maintenance dose of about 1.3 mL per day of ethanol.
White Vinegar Carbon Dosing
The third test was conducted in the middle and right tanks using white vinegar (5% acetic acid). The experiment duration was 29 days.
The system temperature ranged from 27°C to 28°C (80°F to 82°F).
Both tanks were tested long enough to find a maintenance dose. Both tanks had a maintenance dose of just under 12 mL per day, similar to the SAT solution test findings.
The starting test values, values after one month, and the difference values are displayed below:
Middle Tank White Vinegar Test
Middle tank values are as follows:
| Test | Start Value | End Value | Difference |
|---|---|---|---|
| NO3 | 43.4 ppm | 11.5 ppm | - 31.9 ppm |
| PO4 | 1.73 ppm | .72 ppm | - 1.01 ppm |
| pH | 7.8 | 7.6 | - .2 |
| KH | 136 ppm | 115 ppm | - 21 ppm |
| GH | 203 ppm | 210 ppm | + 7 ppm |
| TDS | 356 ppm | 316 ppm | - 40 ppm |
KH, GH, TDS, and pH changes are minor, but worth noting if a system goes months without a water change. Bacteria, archaea, and some aquatic plant species will use KH over time, so a regularly scheduled test is recommended to monitor and adjust as needed.
Right Tank White Vinegar Test
Right tank values are as follows:
| Test | Start Value | End Value | Difference |
|---|---|---|---|
| NO3 | 30.9 ppm | 8.7 ppm | - 22.2 ppm |
| PO4 | 1.50 ppm | 2.86 ppm | + 1.36 ppm |
| pH | 7.4 | 7.3 | - .1 |
| KH | 135 ppm | 85 ppm | - 50 ppm |
| GH | 210 ppm | 216 ppm | + 6 ppm |
| TDS | 380 ppm | 342 ppm | - 38 ppm |
The right tank has 30 grit/mesh sand as a substrate. The 30 grit/mesh allows an anoxic environment to develop in the first centimeter. The higher bioload and heavier feeding of dry food, which does contain phosphate, could have contributed to the increase in PO4.
KH, GH, TDS, and pH changes are minor, but worth noting if a system goes months without a water change. The right tank had a higher fish population, which increased demand for KH (carbonate/bicarbonate) as autotrophic bacteria and archaea oxidized ammonia and nitrite.
No aquatic plants, snails, or fish showed any observable stress from the white vinegar dosing. Aquatic plants had a noticeable increase in growth rate.
This experiment examined whether adding an organic carbon dose to a system lacking anoxic environments could reduce NO3.
A 19 L (5 gallon) bucket was seeded with rocks from the surface and deep within the sand substrate of established aquariums. This procedure establishes a diverse population of bacteria and archaea. The bucket was dosed with white vinegar to increase the microbial populations. No animals or aquatic plants were added. The bucket only received ambient indirect light. The bucket was agitated with an air stone.
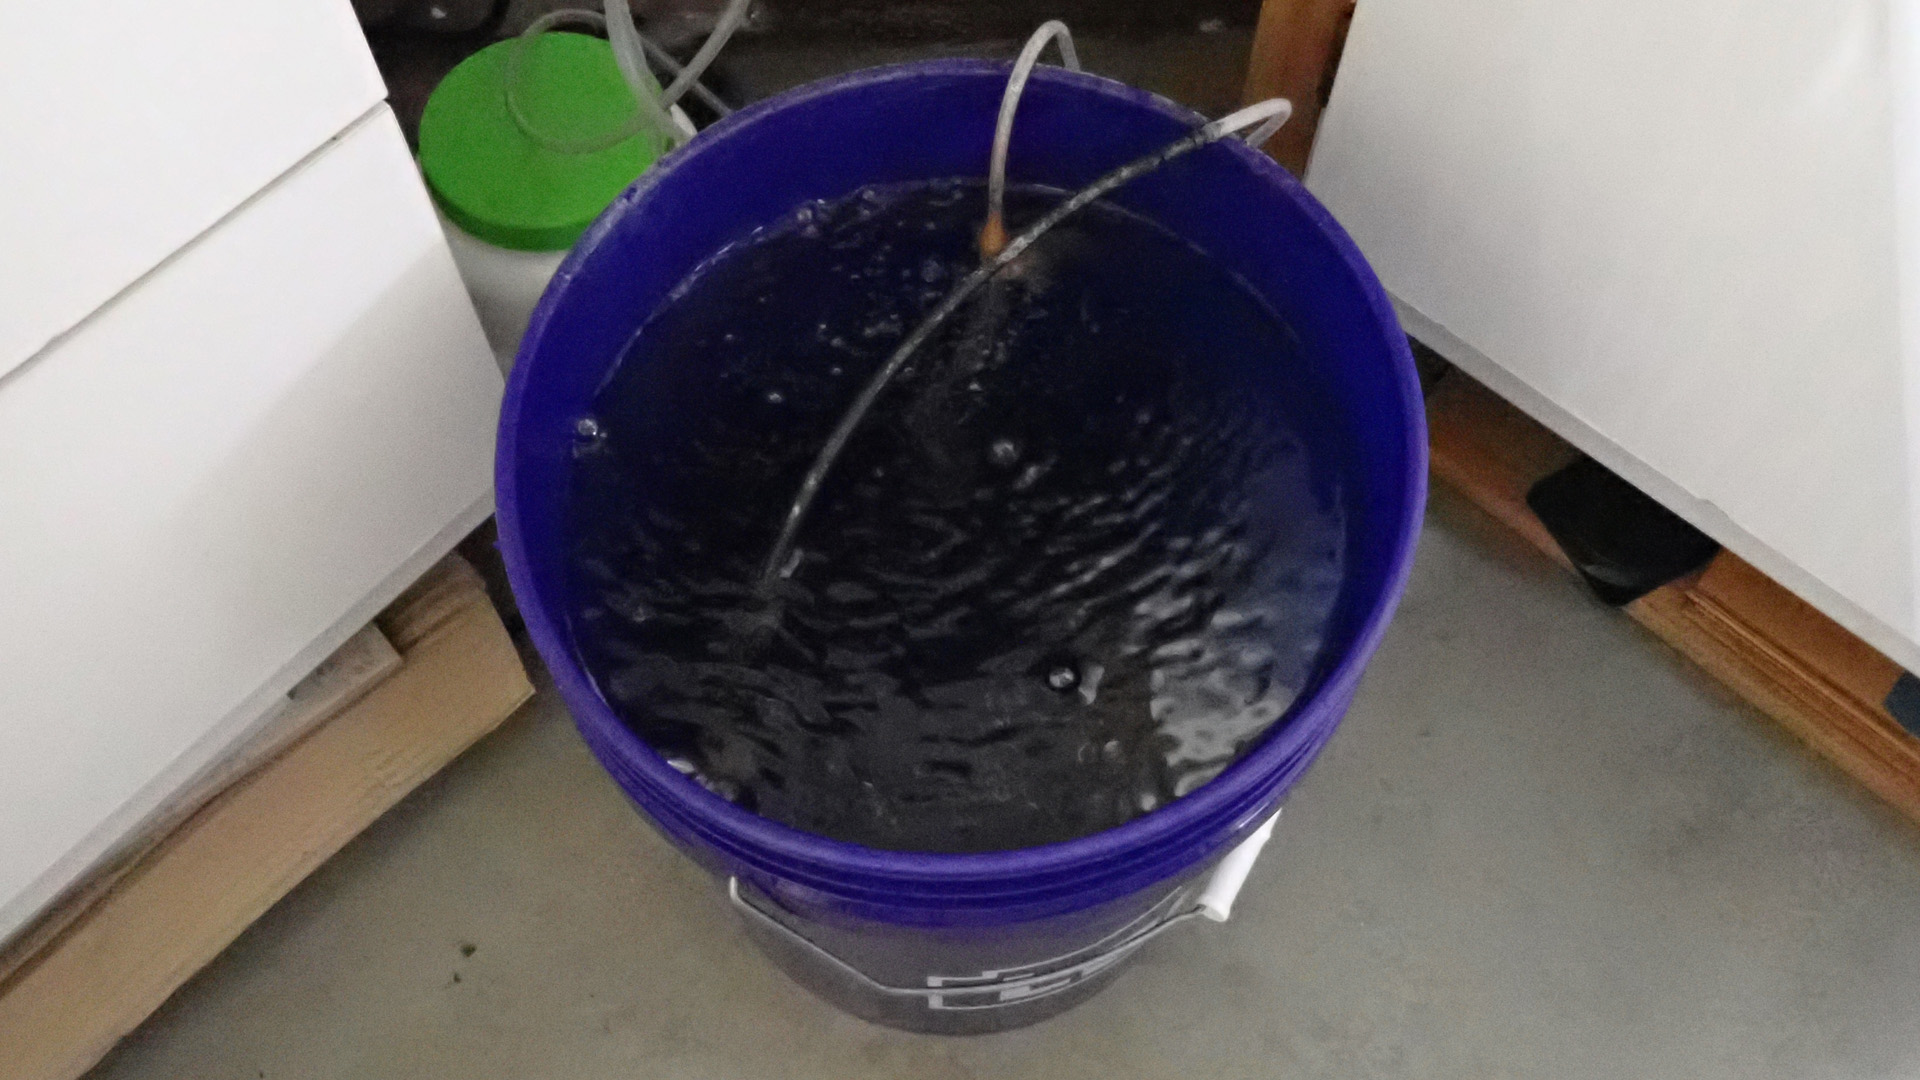
Initially, the NO3 went from 27.3 ppm to 35.1 ppm in 3 days with 6 drops of white vinegar per day. After 3 more days of 12 drops of white vinegar, the NO3 rose to 37.5 ppm. Dosing increased to 2 mL per day for 4 days, and the NO3 dropped to 22.7 ppm. This proved that NRBA were present from the added rocks.
All the rocks were removed to eliminate any anoxic environments. The white vinegar dose was increased to 3 mL per day. After 3 days (2 without rocks), NO3 increased to 26.6 ppm (1.3 ppm per day).
White vinegar was dosed at 3 mL per day for 4 days. This showed an initial drop to 22.7 ppm of NO3, perhaps from residual NRBA left in the bucket after removing rocks.
White vinegar dosing was increased to 5 mL per day for 6 days, and NO3 increased by 0.5 ppm.
Six more days of dosing 5 mL per day showed NO3 decreased by 15.8 ppm (7.6 ppm after 3 days). This data would suggest that NRBA are not reliant on an anoxic environment to reduce nitrate when organic carbon is dosed on a regular schedule. NRBA may exist in an anoxic substrate because it is in close proximity to acetic acid naturally produced by bacteria and archaea.
The data showed that the lack of anoxic environments in the system plays an initial role during carbon dosing, but NRBA can also populate oxic environments when acetic acid is available in the water column from organic carbon dosing.
The data also show that small environmental changes (e.g., removing rocks) can temporarily affect biological processes in a closed system.
Carbon dosing with white vinegar and ethanol was verified in a 114 L (30 gallon) display aquarium and an overstocked 1250 L (330 gallon) outdoor goldfish pond.
Aquarium
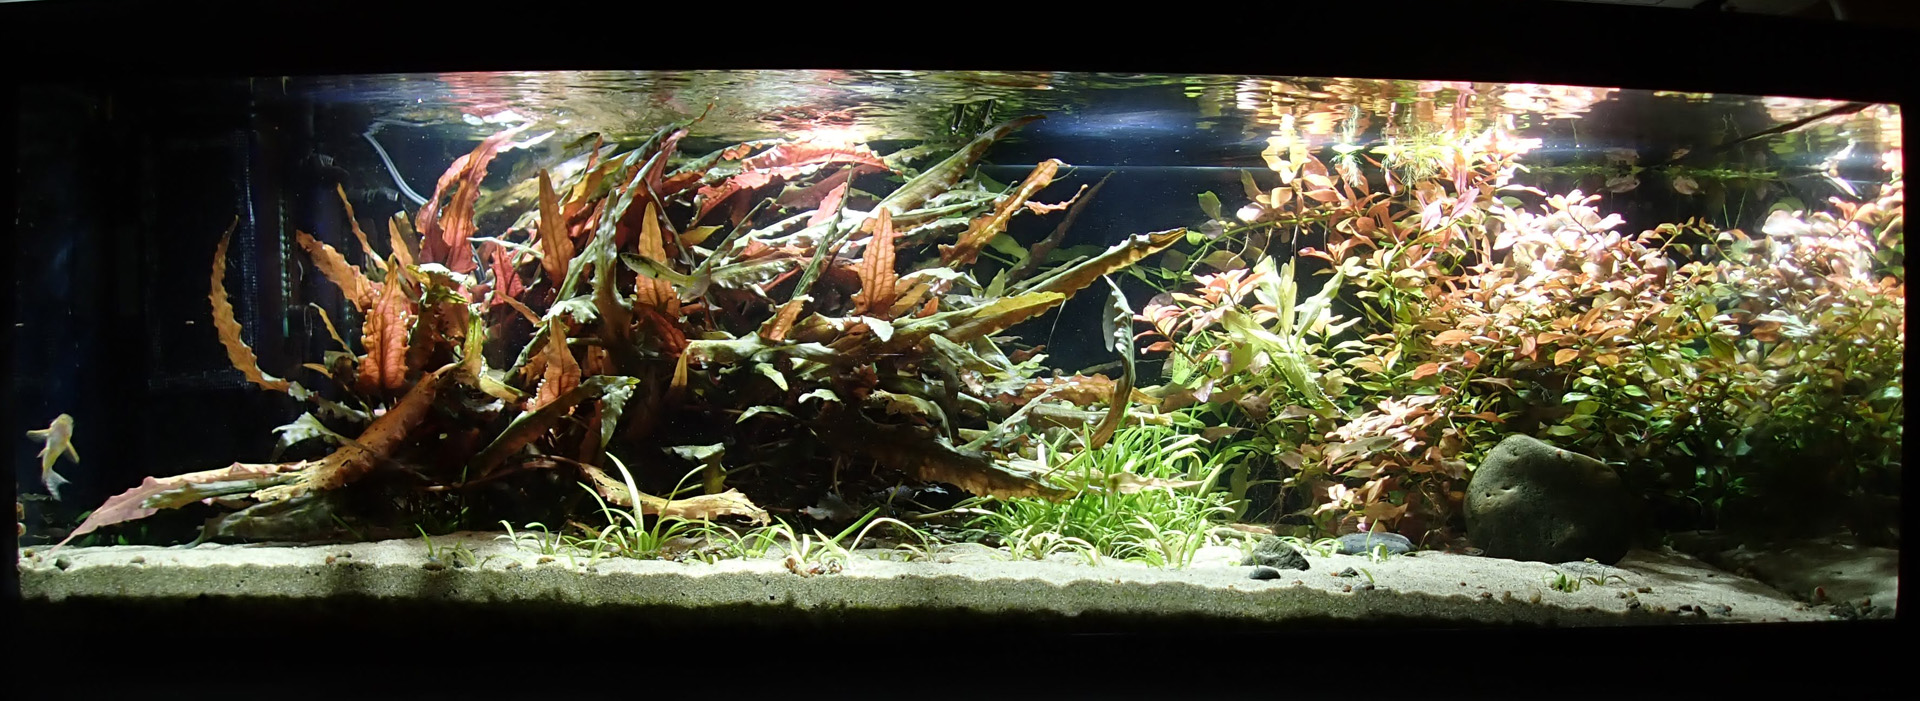
The display aquarium with 60 mesh/grit sand was stocked with the same aquatic plants found in the lab tanks, and Mikrogeophagus ramrirezi (ram dwarf cichlids), Hoplisoma sterbai (Sterba's corydoras), and Ancistrus spp. (bushy nose plecostomus).
Before dosing with ethanol, aquarium NO3 accumulated at 2 ppm per day. Dosing 3 mL of ethanol per day decreased NO3 by 19.6 ppm in three days, or 6.5 ppm per day. This test showed 8.5 ppm of NO3 was removed per day.
Pond
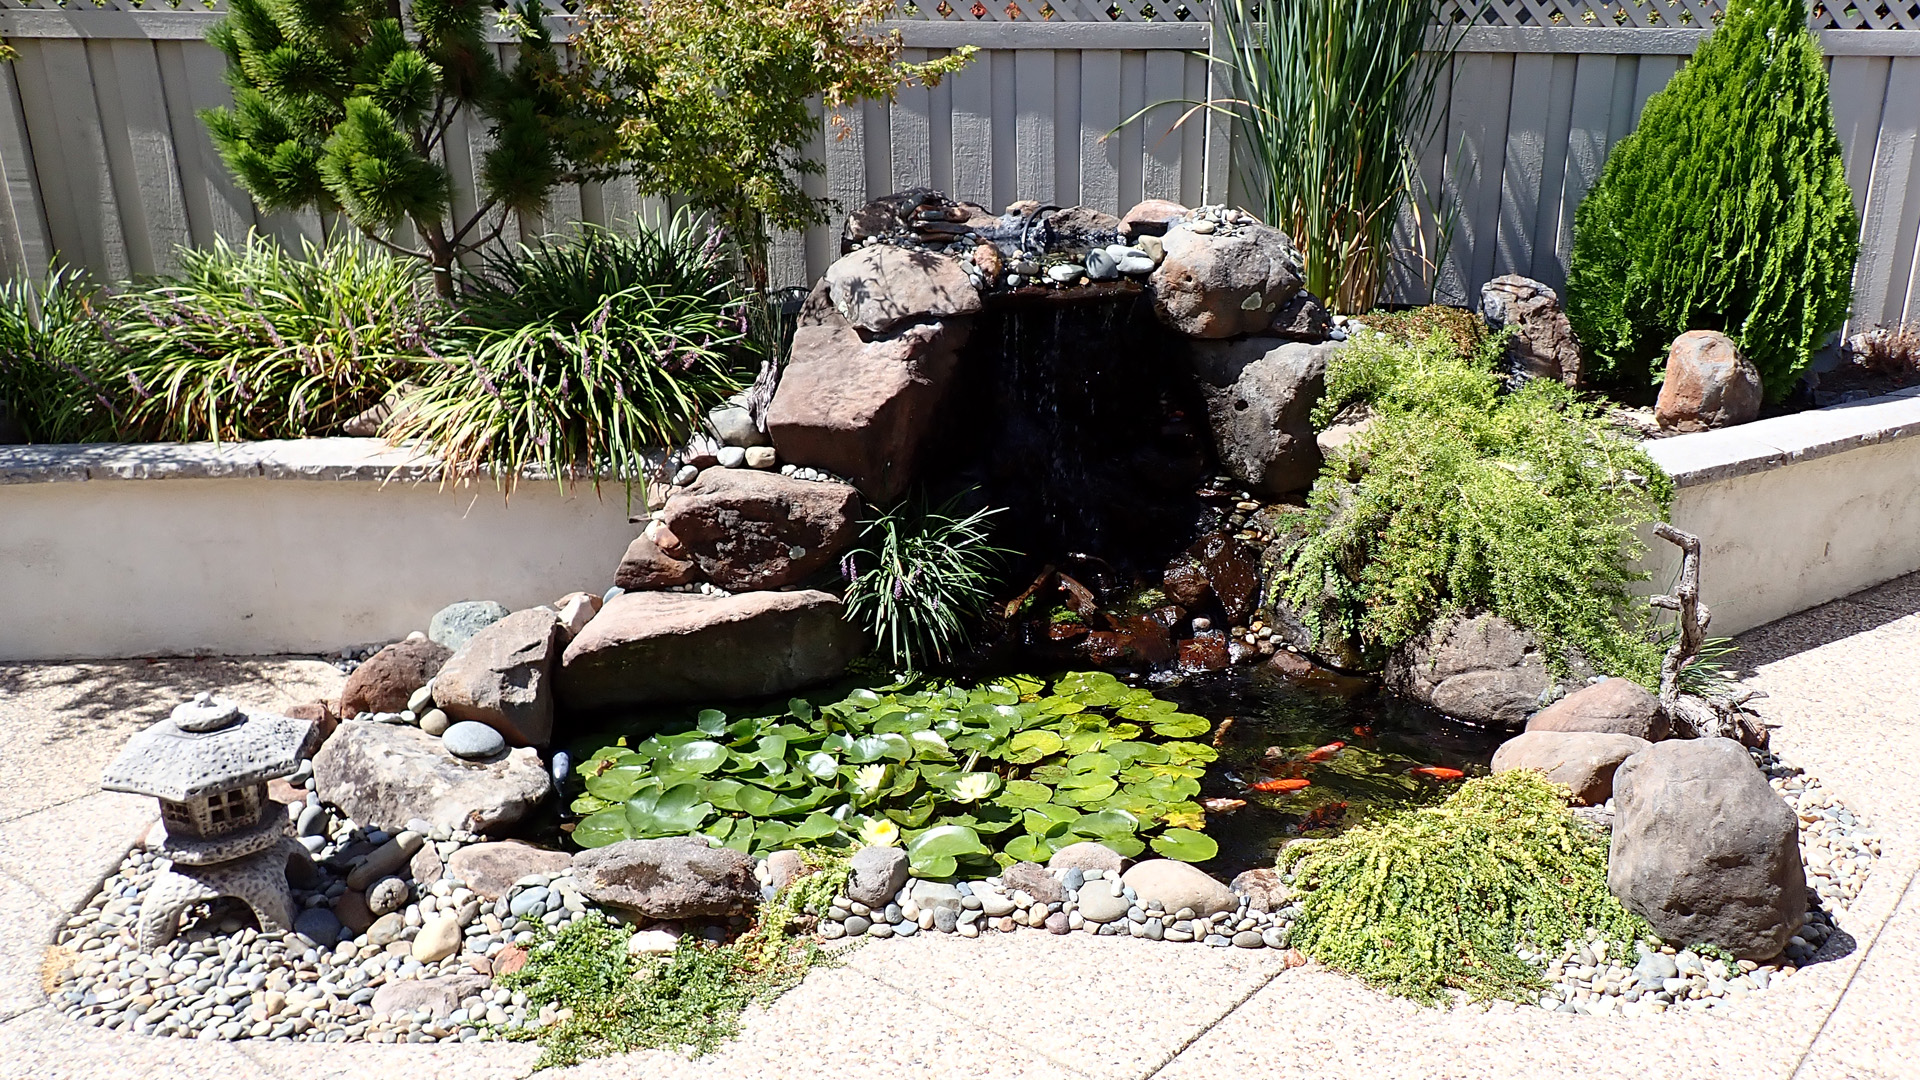
The pond is stocked with Typha latifolia (cattail), Lysimachia nummularia (creeping Jenny), Ludwigia repens (creeping primrose-willow), Nymphaea spp. (water lily), Sagittaria subulata (narrow leaf dwarf sag), and Pistia stratiotes (water lettuce) aquatic plants. The fish in the pond are Carassius auratus (goldfish), Heterandria formosa (Least killifish), and Gambusia holbrooki (Eastern mosquitofish). The system uses a true slow-flow bog filter with a sand substrate.
Before dosing with ethanol and white vinegar, pond NO3 accumulated at 3.15 ppm per day. Dosing 35 mL of ethanol and 40 mL of white vinegar per day decreased NO3 by 11.5 ppm in five days, or 2.3 ppm per day. This test showed 5.45 ppm of NO3 was removed per day.
Nitrate and phosphate levels can also be affected by the fish food choices. Nitrate is directly affected by the protein content of fish food. Most flake and pellet foods contain a significant amount of phosphate, which shows up in test results. A short lab test showed a significant decrease in PO4 levels in two lab systems when only frozen brine shrimp was fed for three days.
Wiping bio-mat slime off the airline in the bucket caused a temporary increase in NO3.
Organic carbon dosing is very effective in reducing nitrate. For aquatic systems that produce excessive nitrate, implementing a carbon-dosing schedule will control NO3 levels in systems with anoxic environments (e.g., sand substrate).
Ethanol and white vinegar have very little to no effect on the system water chemistry and are the best options for carbon dosing. Because white vinegar has a lower carbon density, it may be a better choice for automated dosing in many cases. If a system is very large, such as a public aquarium or pond, vodka’s carbon density may make it the most cost-effective yet riskier option for automated dosing.
Because sodium acetate significantly affects KH and TDS, most closed freshwater aquatic systems are easier to manage with white vinegar or ethanol as the carbon source.
Mixing carbon sources to target KH depletion over time is a good strategy for maintaining alkalinity in high-bioload systems.
When dosing carbon, digital colorimeters for nitrate and phosphate are essential tools that provide the precision needed to measure changes and prevent nitrate and phosphate limitation. Liquid and strip tests lack the precision needed to monitor the low levels of NO3 (< 10 ppm) and PO4.
Substrate size affects the anoxic environment needed for natural anaerobic denitrification, but when organic carbon is dosed into the water column, NRBA will also populate oxic substrate. Carbon in the form of acetic acid is the food that accelerates NRBA reproduction and supports the larger population that processes NO3 to N2 and utilizes PO4.
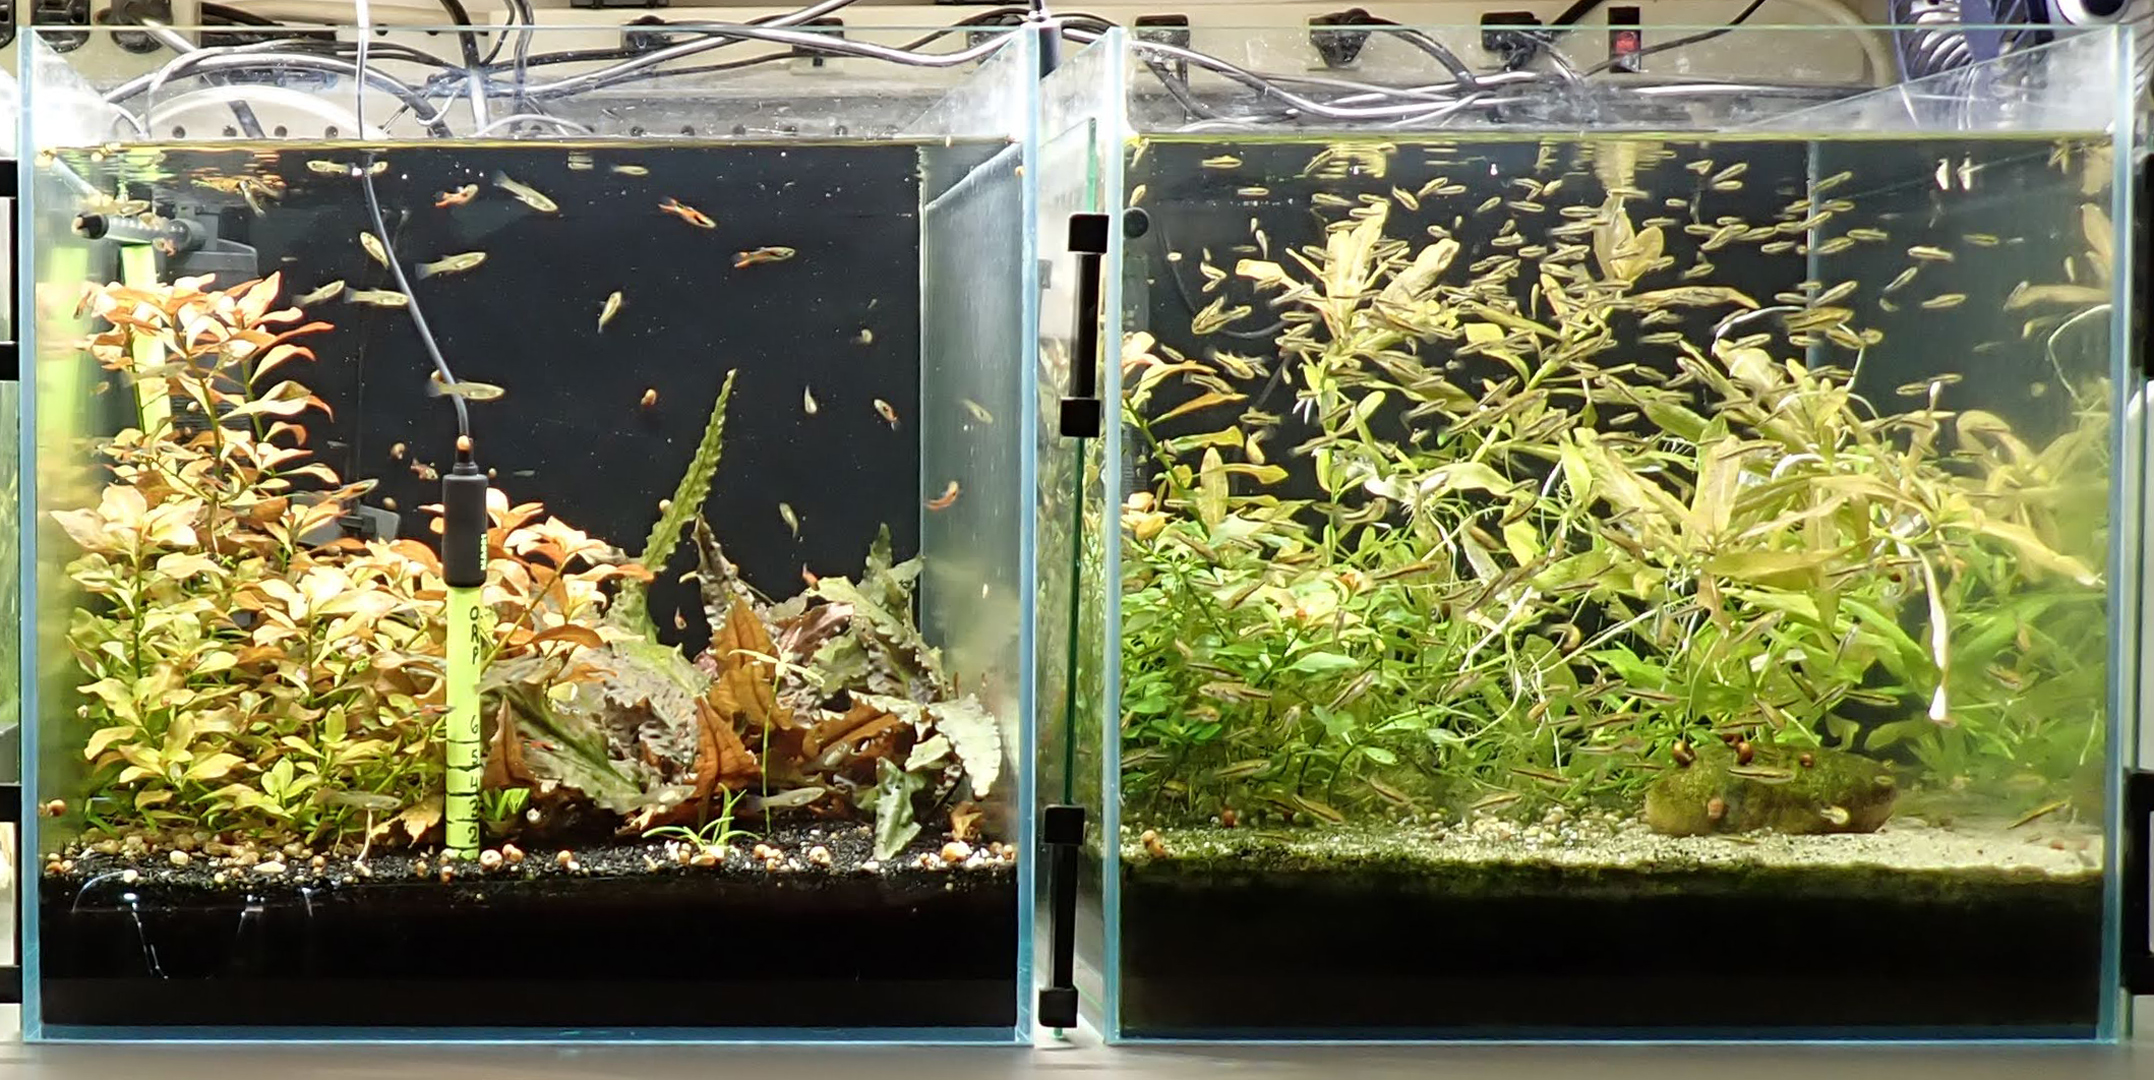
Freshwater systems with aquatic plants will benefit from the accelerated CO2 production by bacteria and archaea. Aquatic plant growth was so robust in test systems that it had to be trimmed and removed in significant amounts several times.
Example of plant growth rate with only ethanol carbon dosing for 12 days:
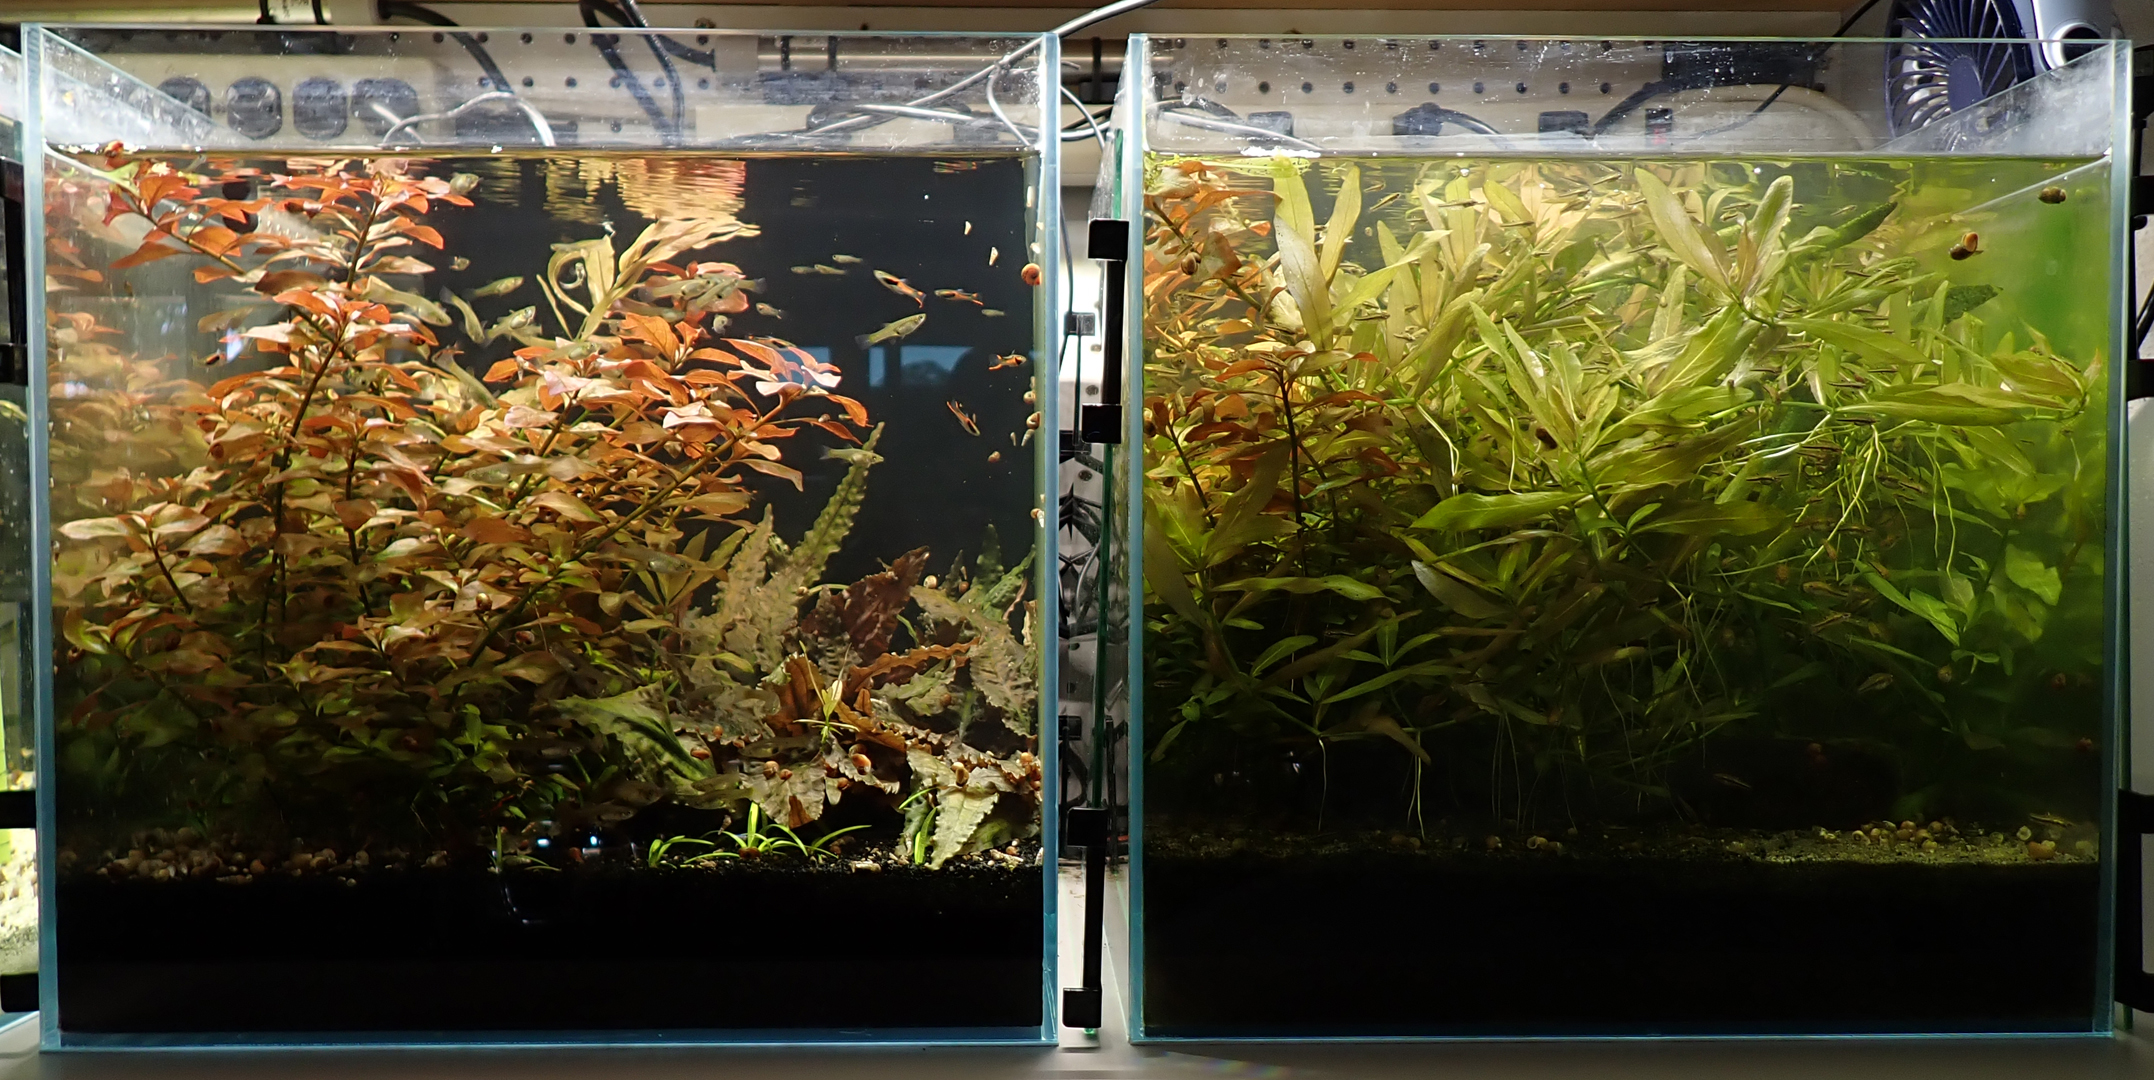
No adverse health issues were noted with the animals and aquatic plants in the systems with the three carbon sources.
If organic carbon dosing is implemented in a system for managing nitrate, monitoring KH and GH consumption by biological processes must also be done, as they can change significantly over time depending on stocking density.
- Daniel F Gomez Isaza, Rebecca L Cramp, Craig E Franklin, Simultaneous exposure to nitrate and low pH reduces the blood oxygen-carrying capacity and functional performance of a freshwater fish, Conservation Physiology, Volume 8, Issue 1, 2020, coz092, https://doi.org/10.1093/conphys/coz092
- Tony Griffitts, 2024, From the Aquarium Lab - Oxidation Reduction Potential of Substrate Evaluating ORP Values of Substrate Size, Depth, and the Effect of Current
- Tony Griffitts, 2024,Biological Processes in Substrate - Maximizing the Potential Benefits of the Bottom of the Aquarium
- Daisuke Tanikawa, Yuka Nakamura, Hiromi Tokuzawa, Yuga Hirakata, Masashi Hatamoto, Takashi Yamaguchi, Effluent treatment in an aquaponics-based closed aquaculture system with single-stage nitrification–denitrification using a down-flow hanging sponge reactor, International Biodeterioration & Biodegradation, Volume 132, 2018, Pages 268-273, ISSN 0964-8305, https://doi.org/10.1016/j.ibiod.2018.04.016